Interface
A user must have staff level permissions for some operations involving changes to the system
Header→
The header bar allows you access to data products/apps deployed and the management interface. The non-technical end-user typically uses the analyst interface. The administrator uses the developer interface. The developer interface requires staff permissions. User can switch between the two by clicking on the address bar.


App Store→
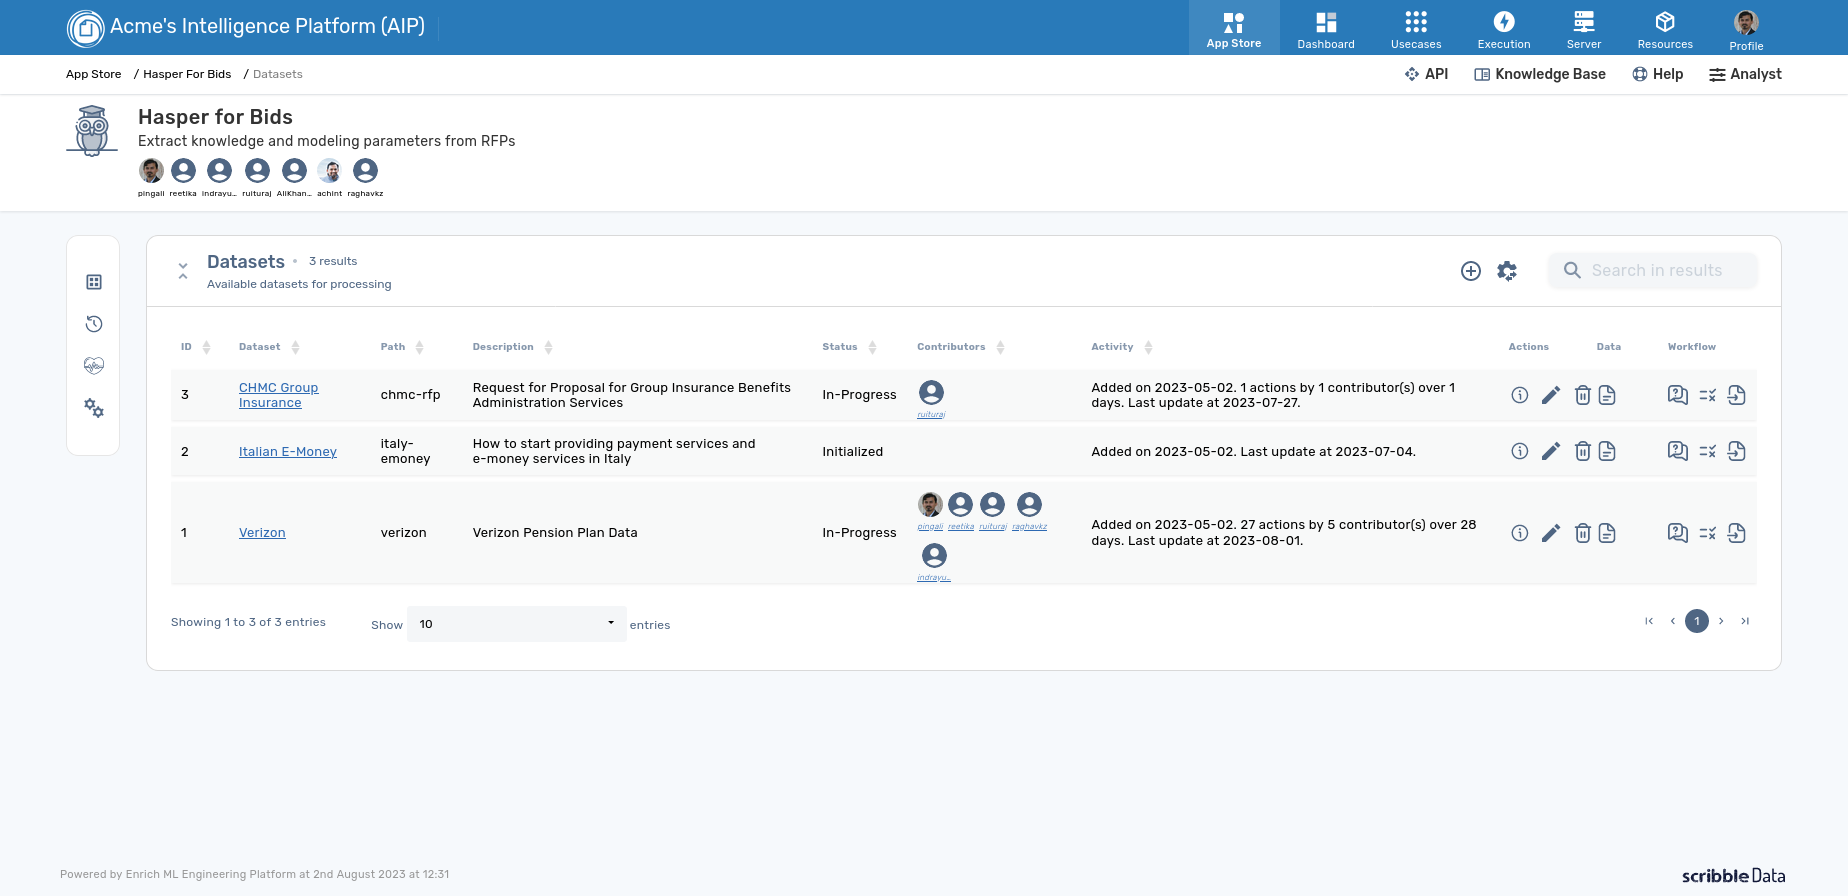
The App Store is a market place of Apps or Data Products, each of which is designed to address one narrow usecase.
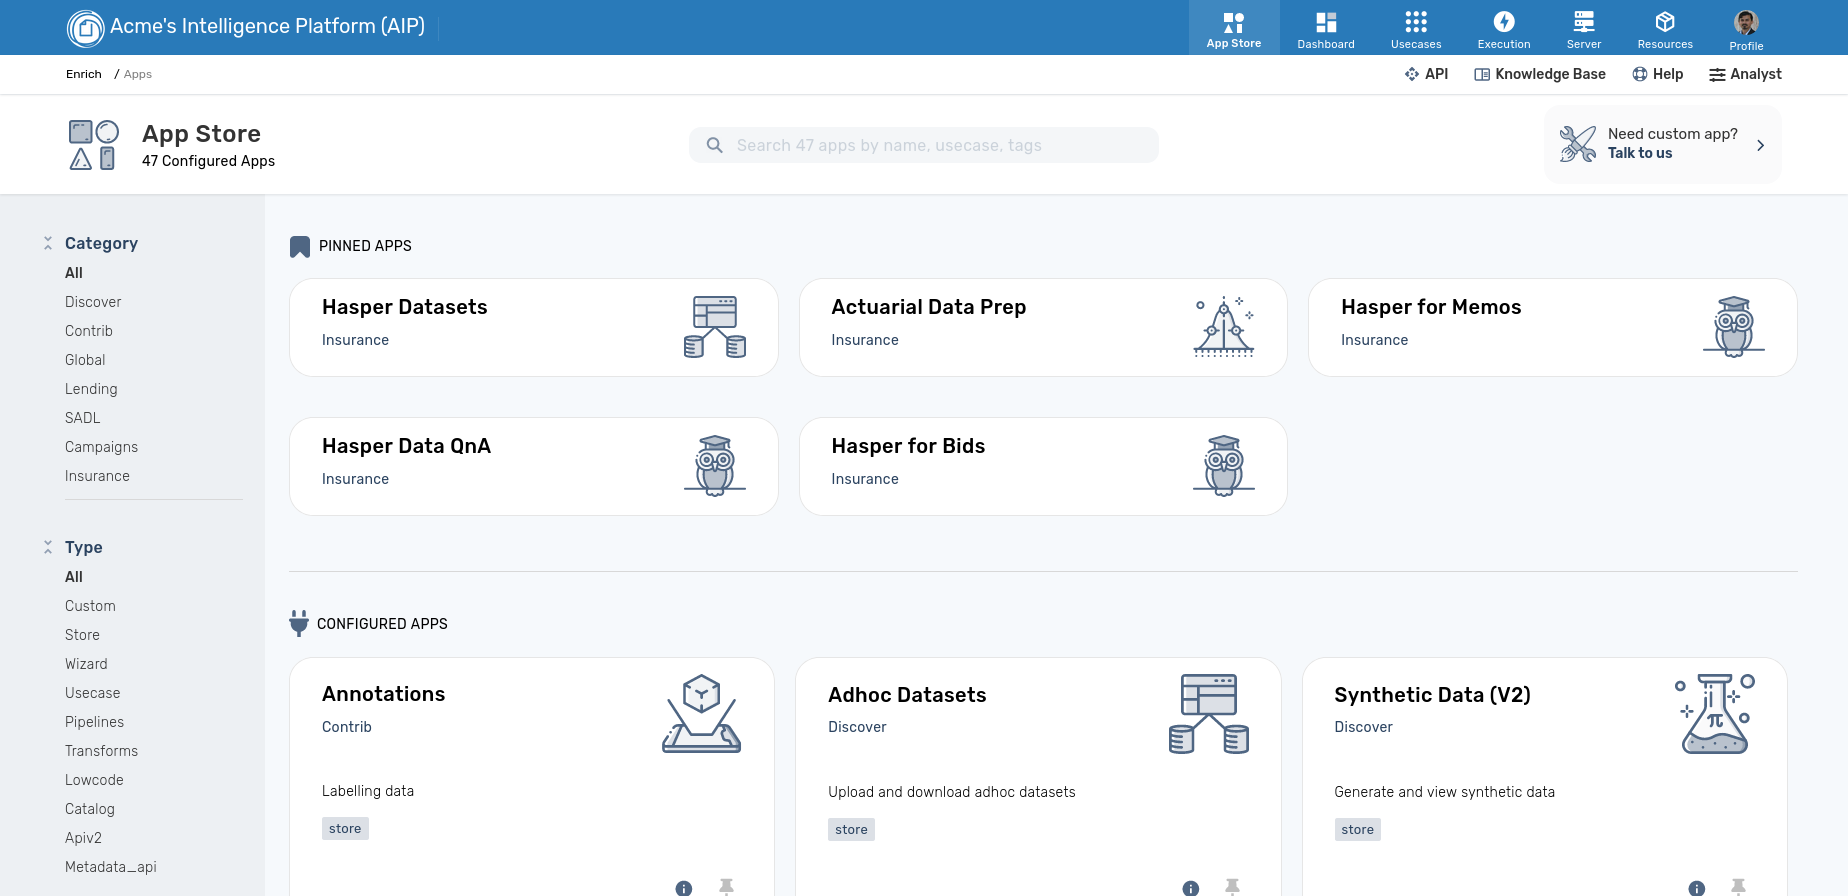
Each app has its own workflow and integrations. Here is the interface for one app called "Hasper for Bids". Hasper is the GenAI framework that enables building of GenAI apps.
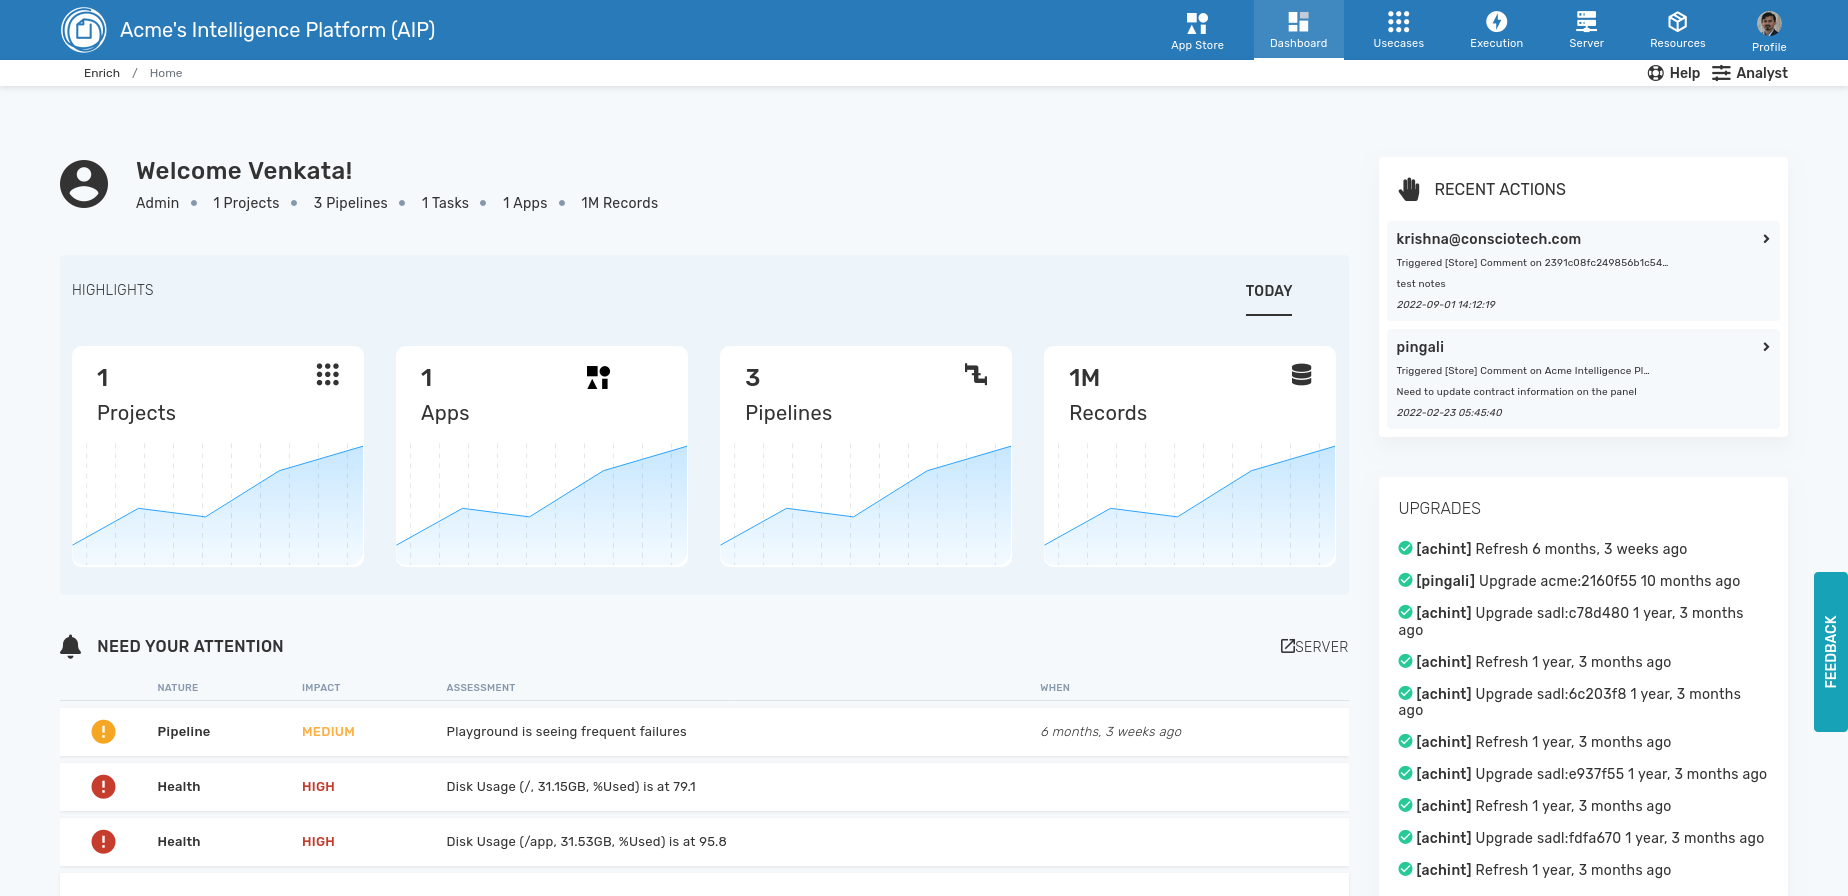
Dashboard→
This is an administrative view that gives a single page summary of the system status. From here users can see the rollouts, pipeline status.
Usecases→
This is administrative interface allows users to view all the various pipelines deployed, organized by usecase groups. The grouping could be driven by datasets the components access, organizational unit, or the function they are expected to perform. RBAC within the platform is based on the usecase.
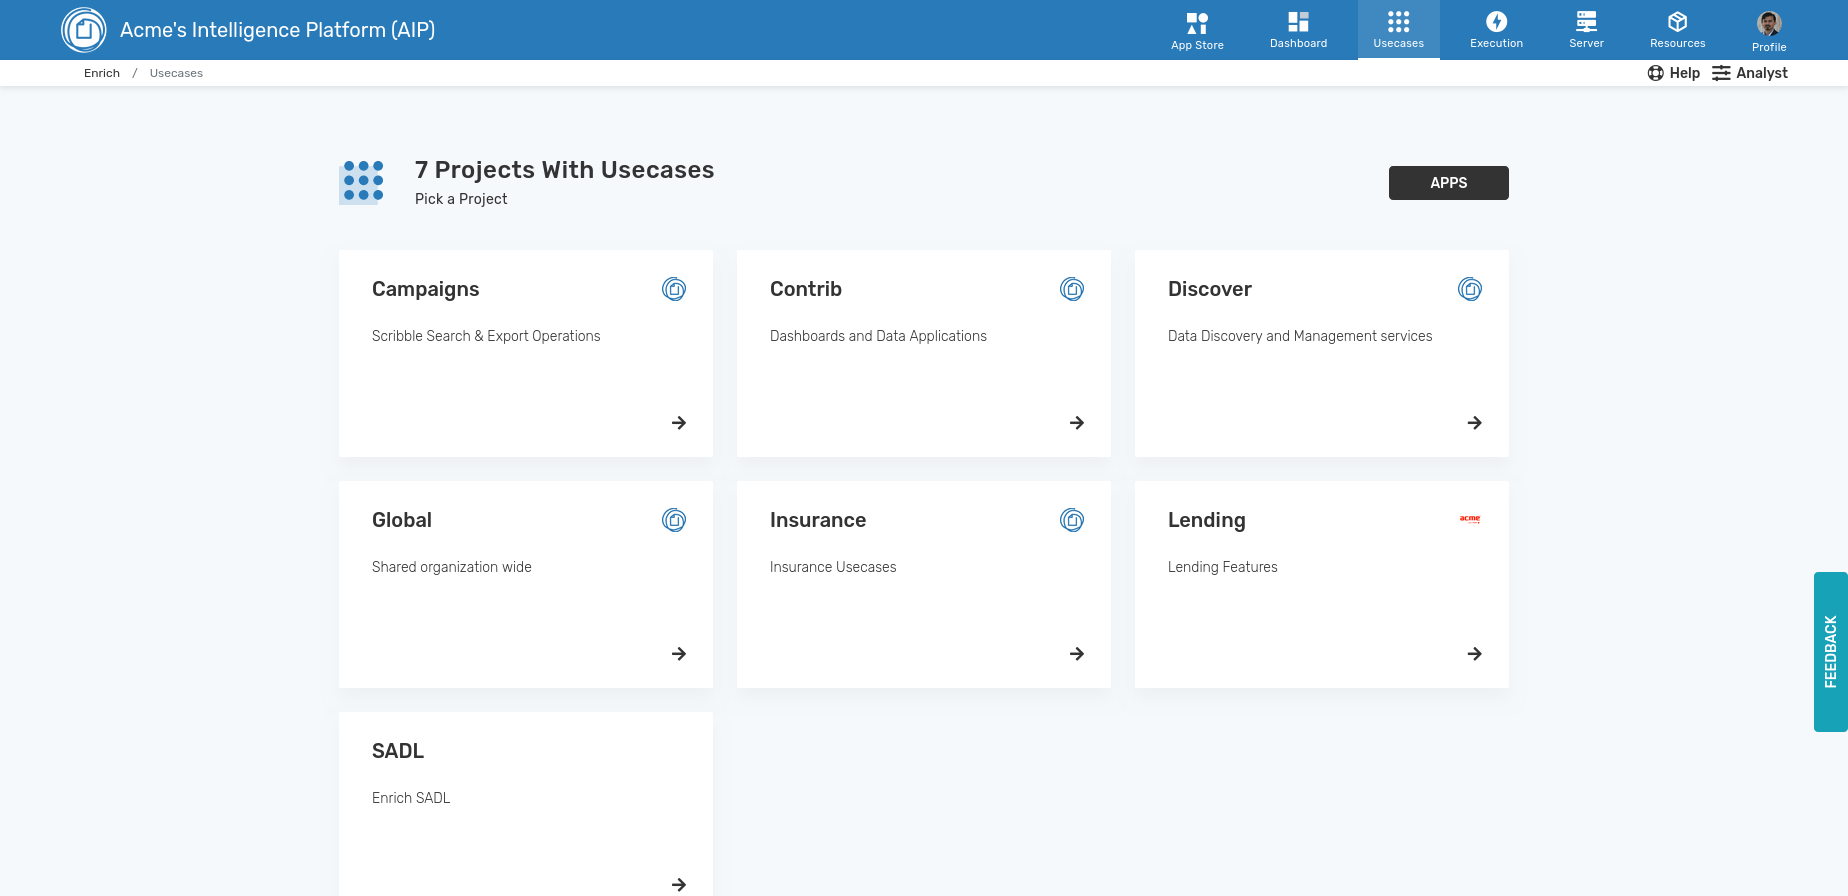
Each usecase group is collection of transforms (data transformation plugins), pipelines (a DAG of transforms), tasks (miscellanious to do backup etc.), assets (reusable libraries), and workflows (collection of pipelines).
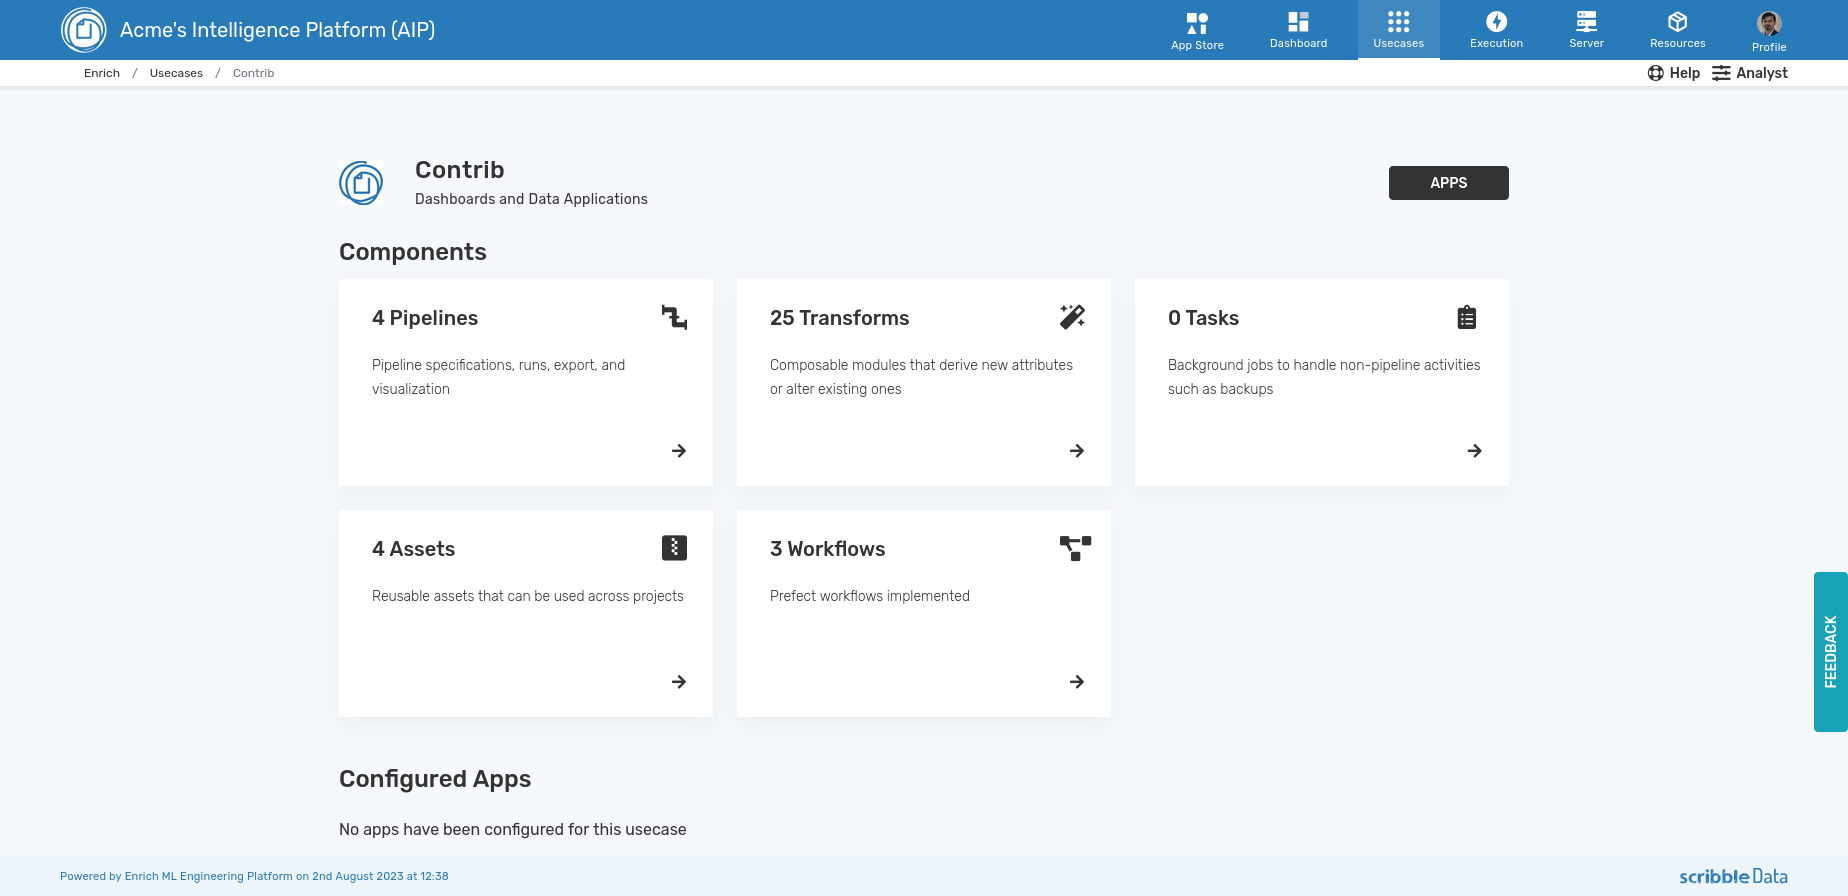
Pipelines are the computational units. All usecases involve one or more pipelines. The interface allows you to navigate to various pipelines, runs associated with each of the pipelines, and the see the detail of each run.
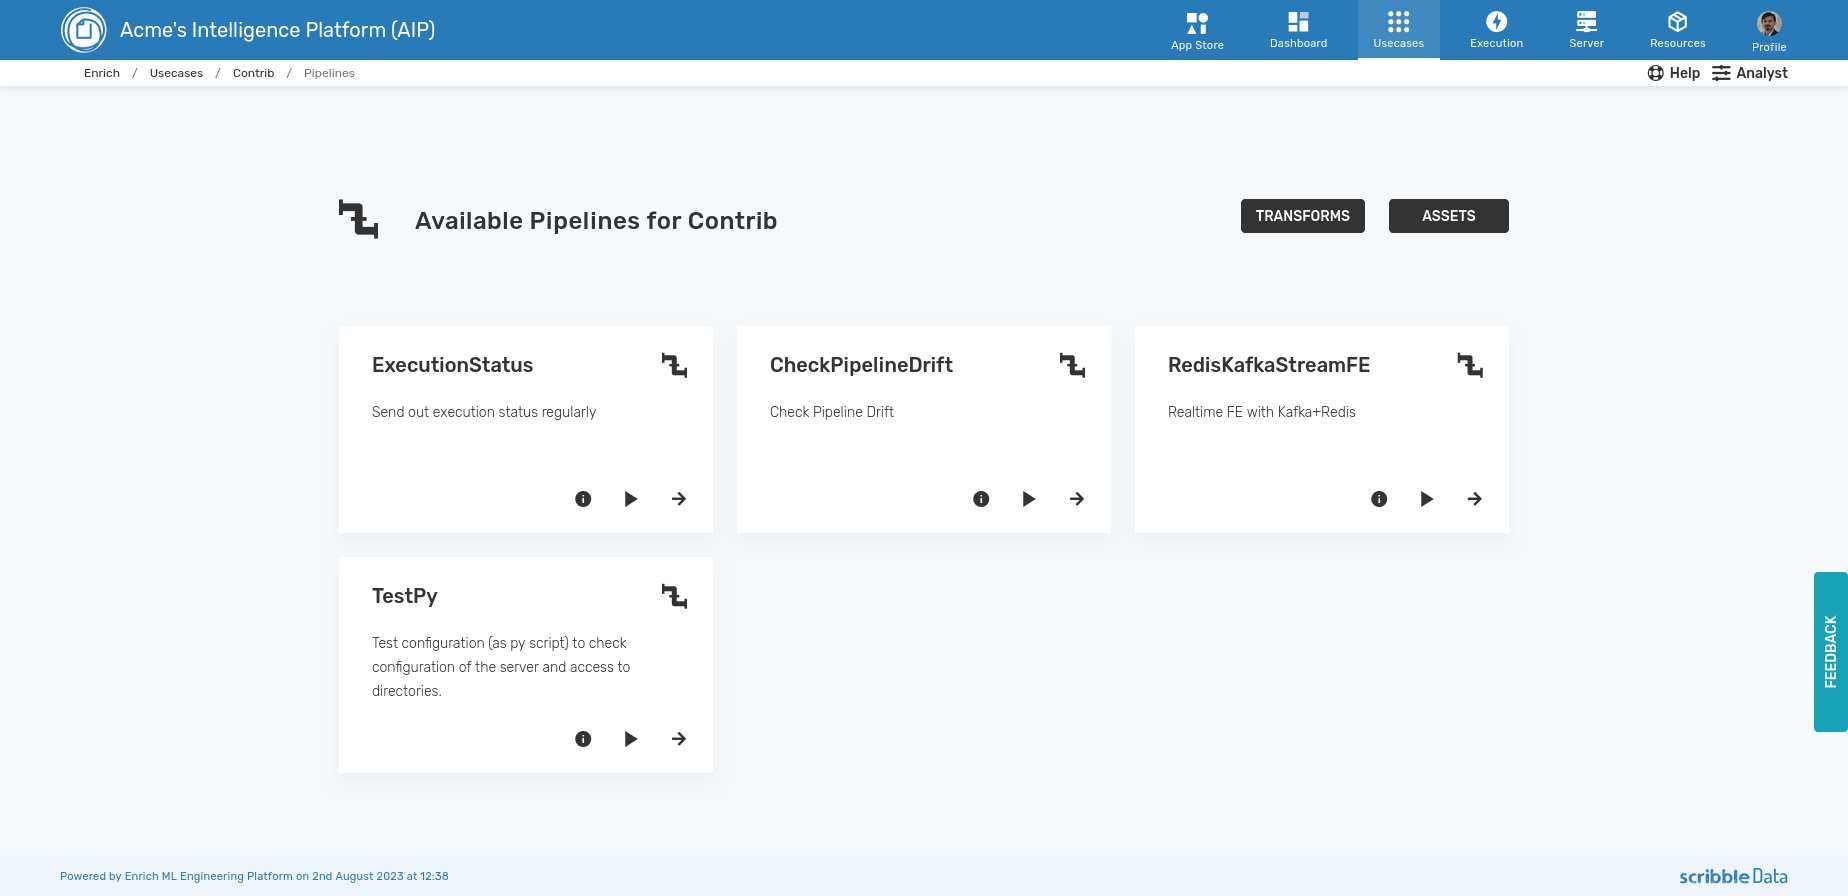
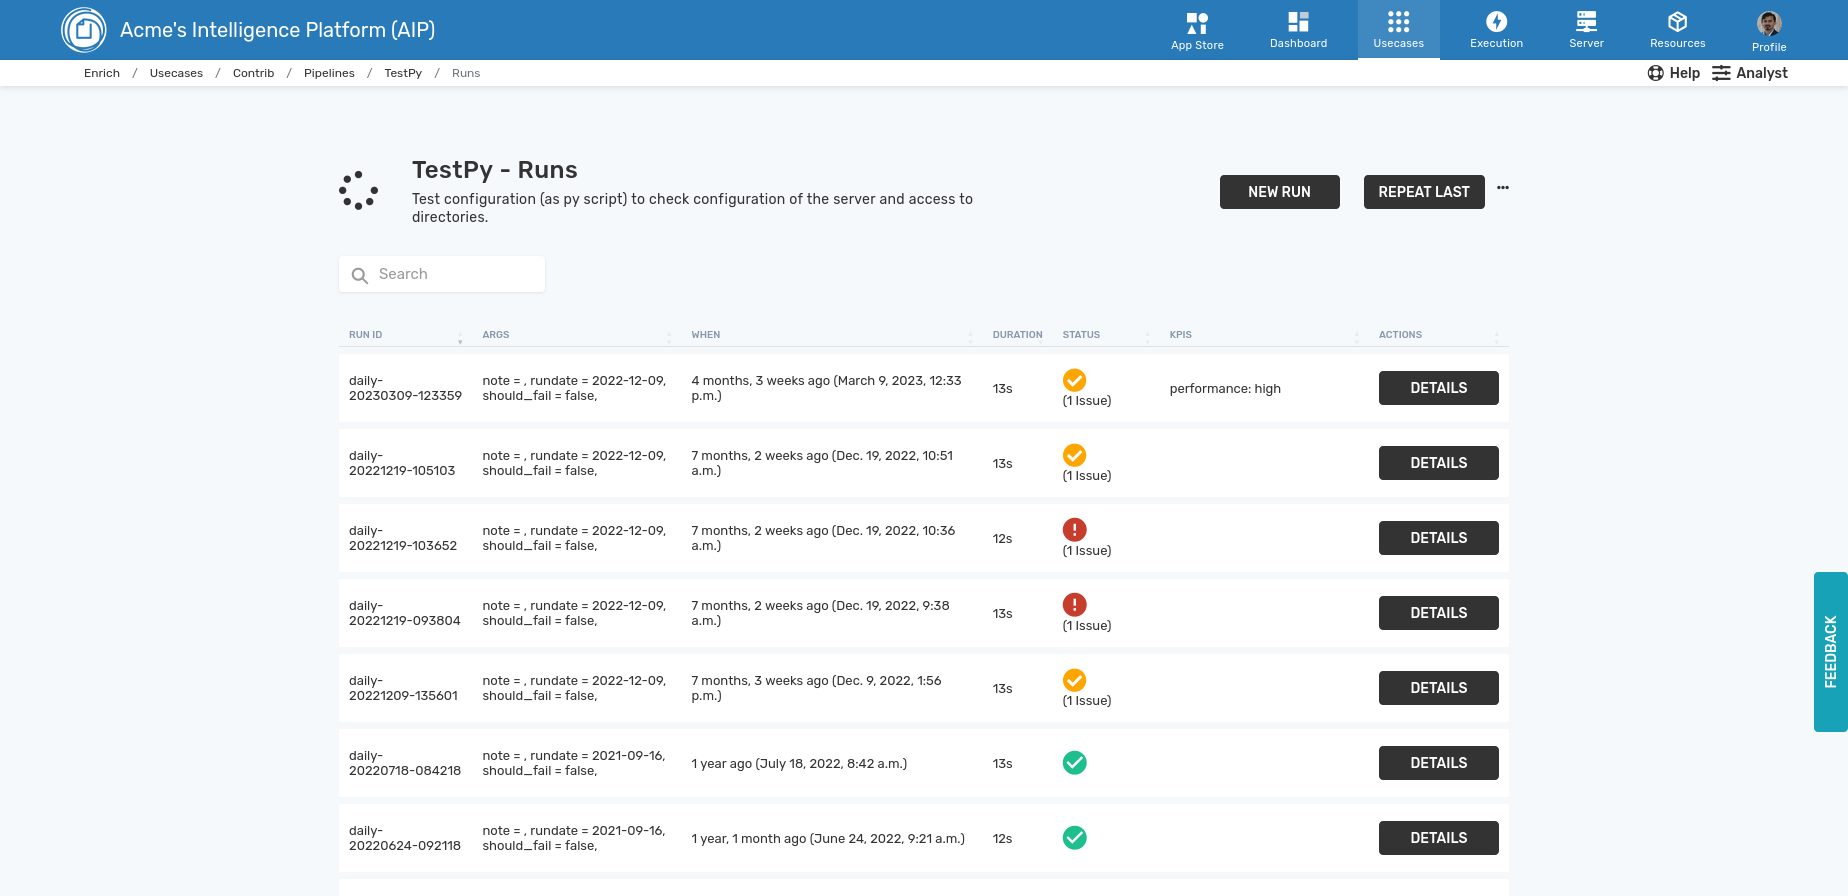
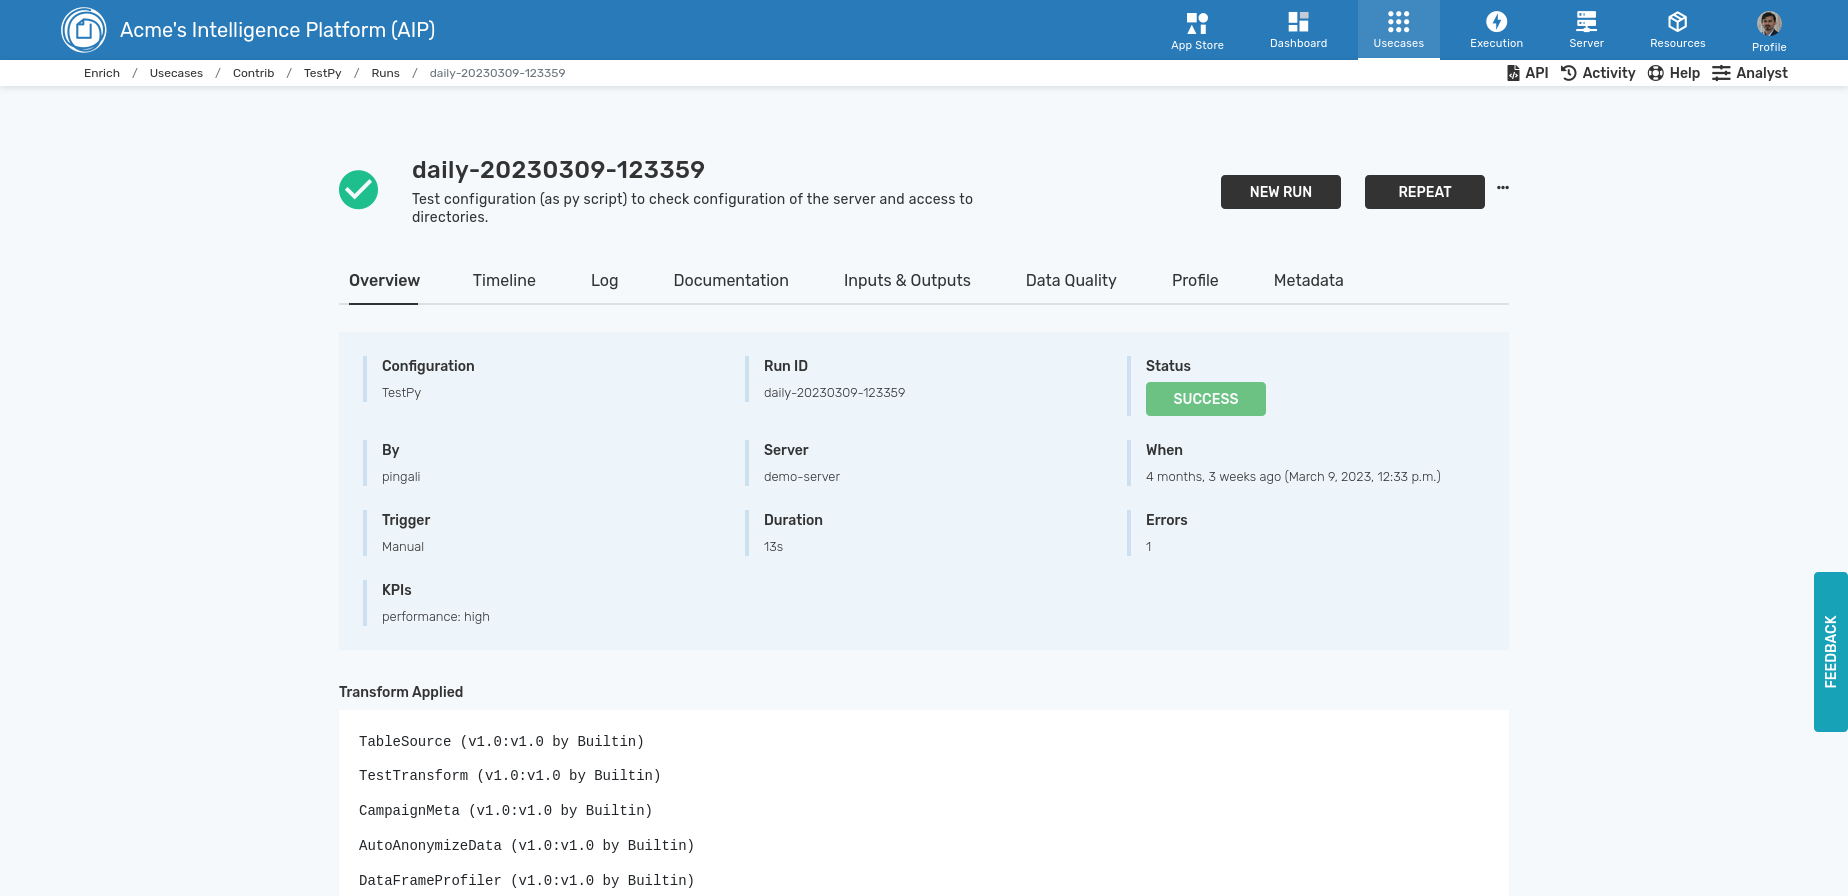
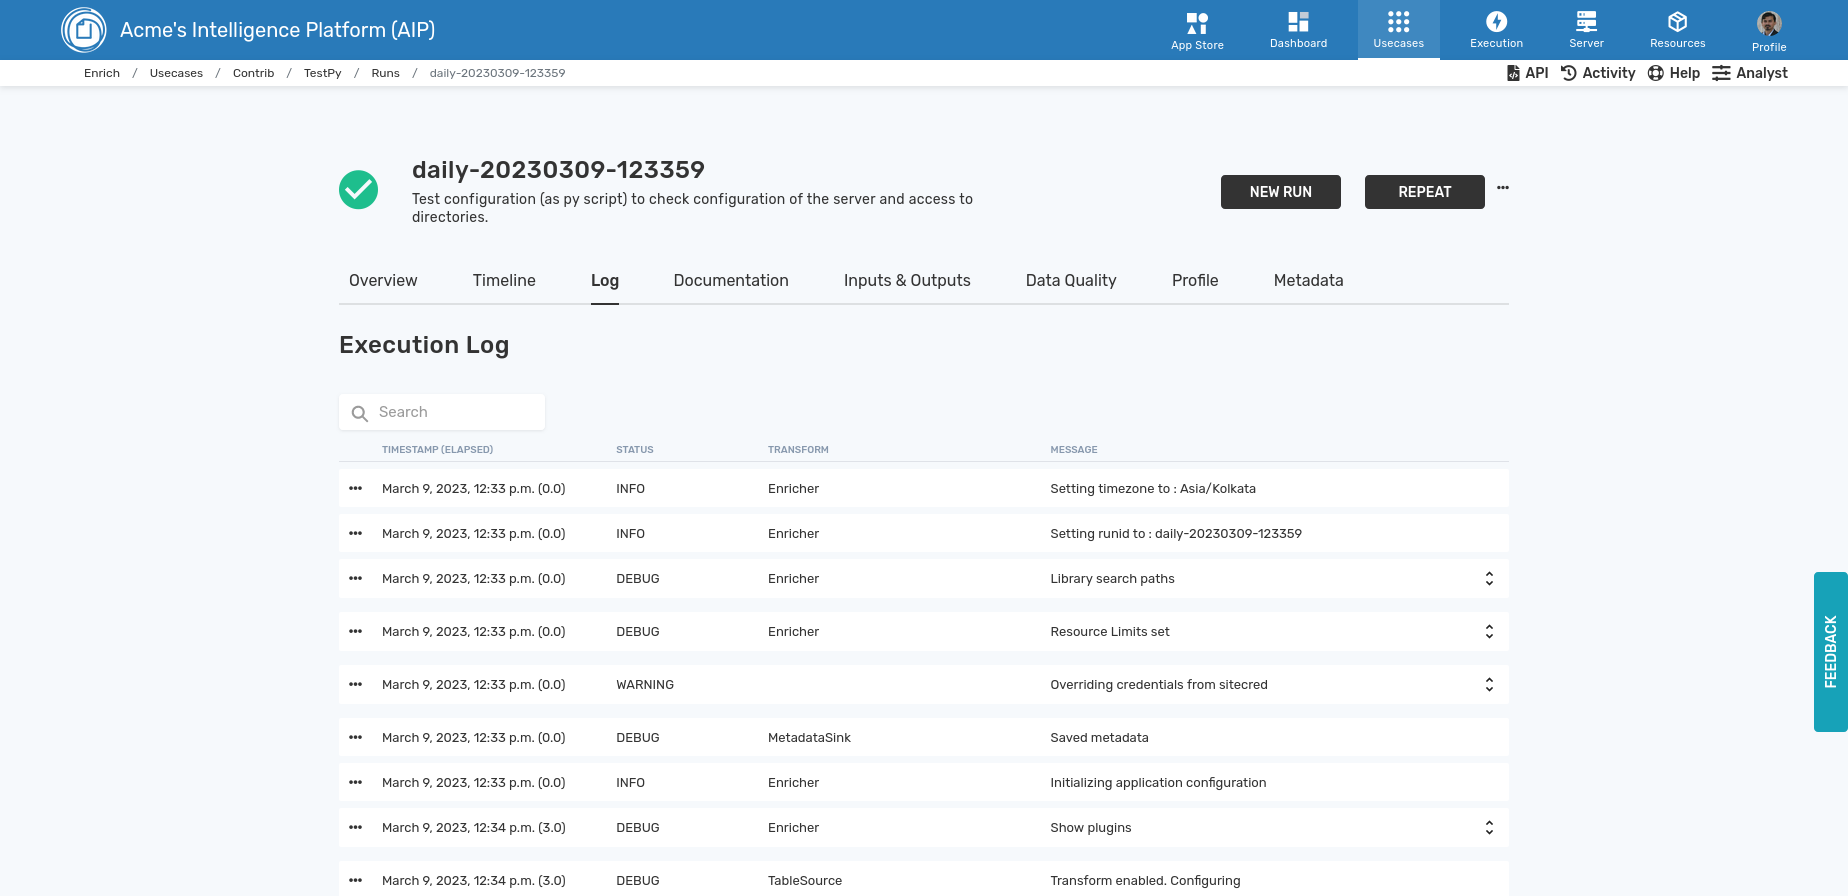
There is extensive metadata associated with each pipeline run. You can see them in the various tabs associated with the run.
Execution→
The execution menu allows the user to see and manage all outstanding pipelines and tasks. In addition it surfaces management information on a number of different aspects of the server:
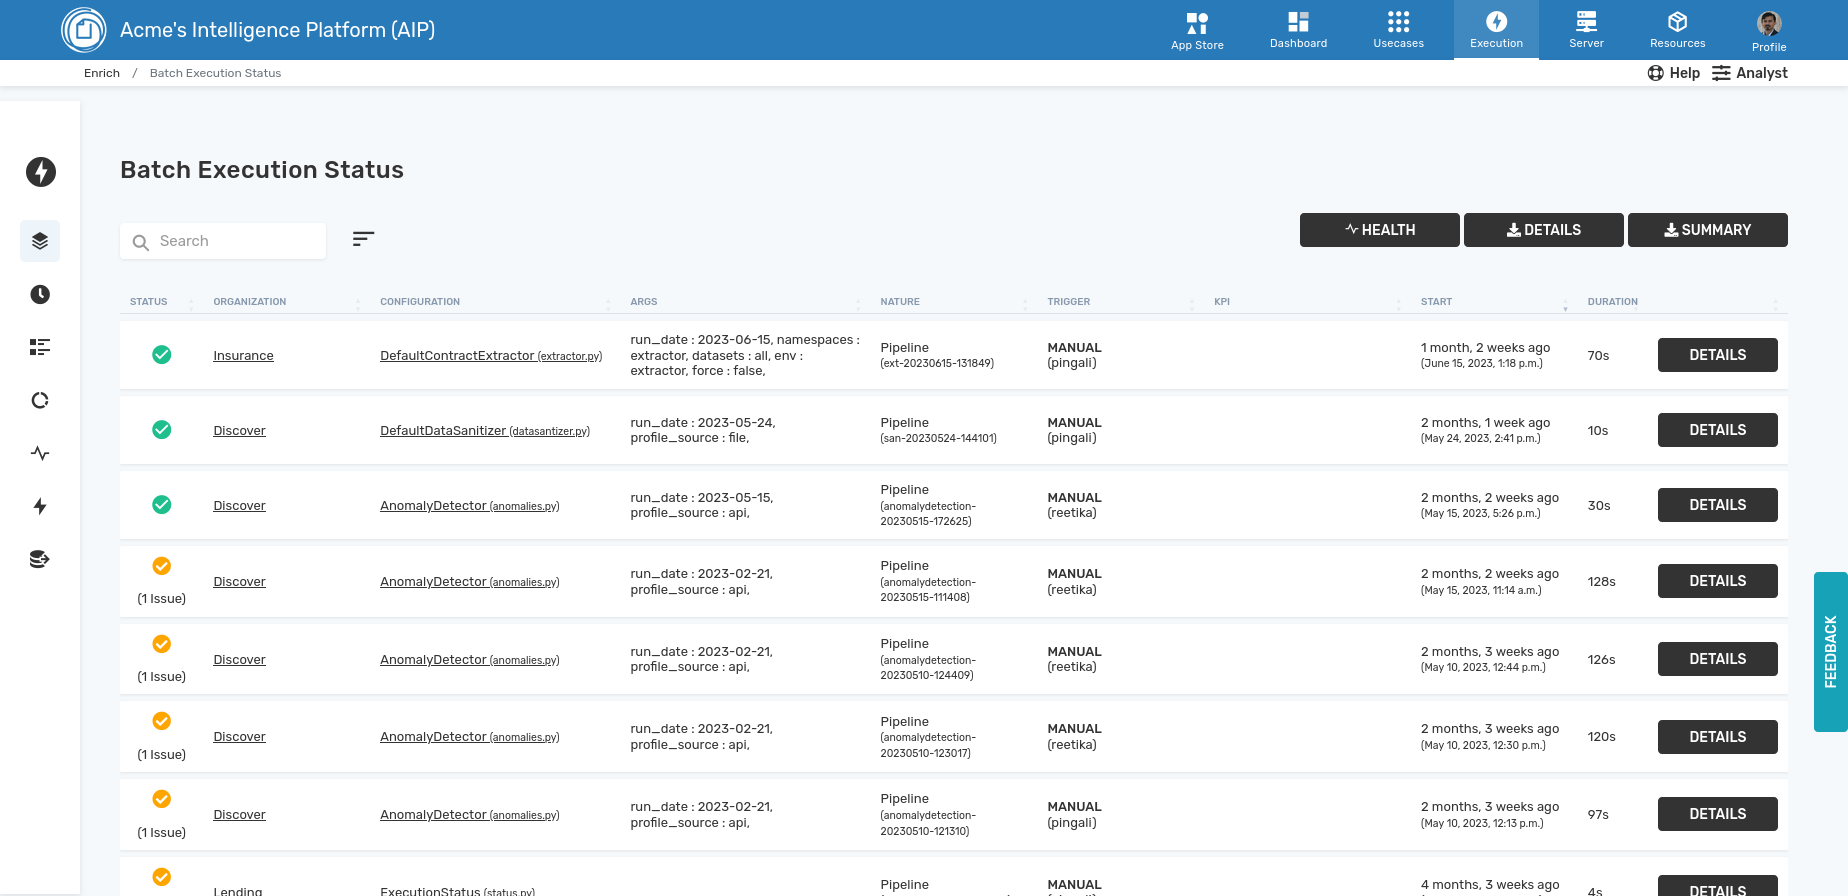
- Batch Exec Status - execution status of batch pipelines
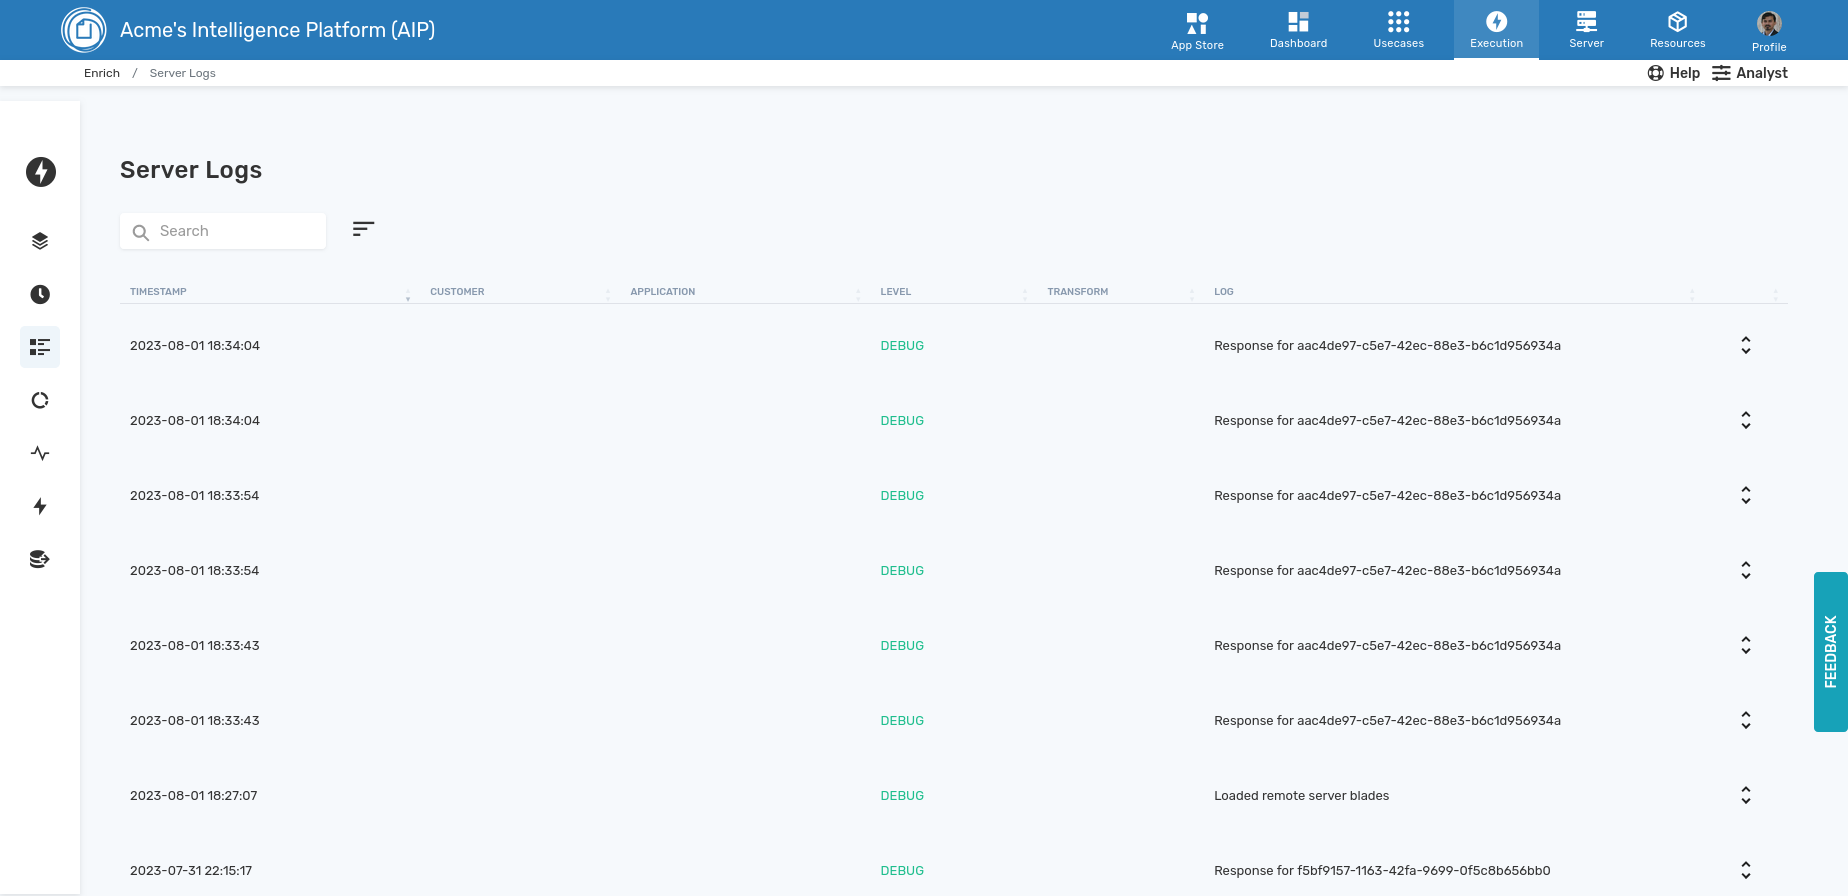
- Server Log - debug log of the server
- LLM - Status of the LLM (GenAI) TaskBlades
- Health - Checks on run logs and system logs to highlight any issues
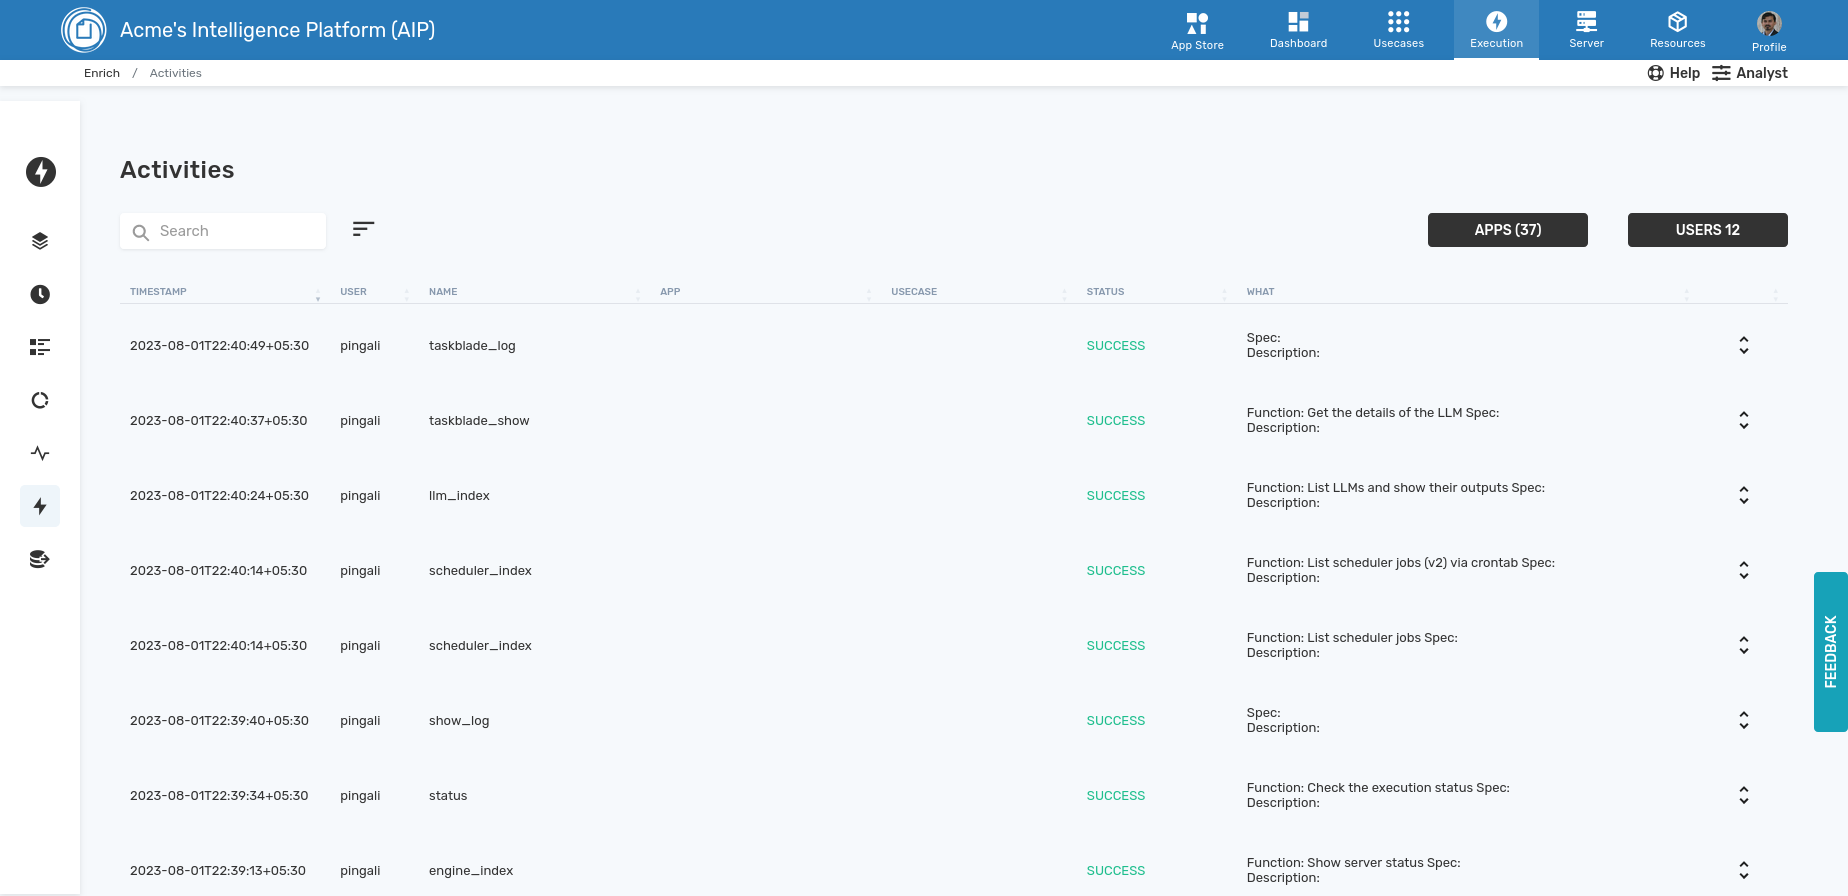
- Activity - all user accesses
- Data Exports - Any secure exports
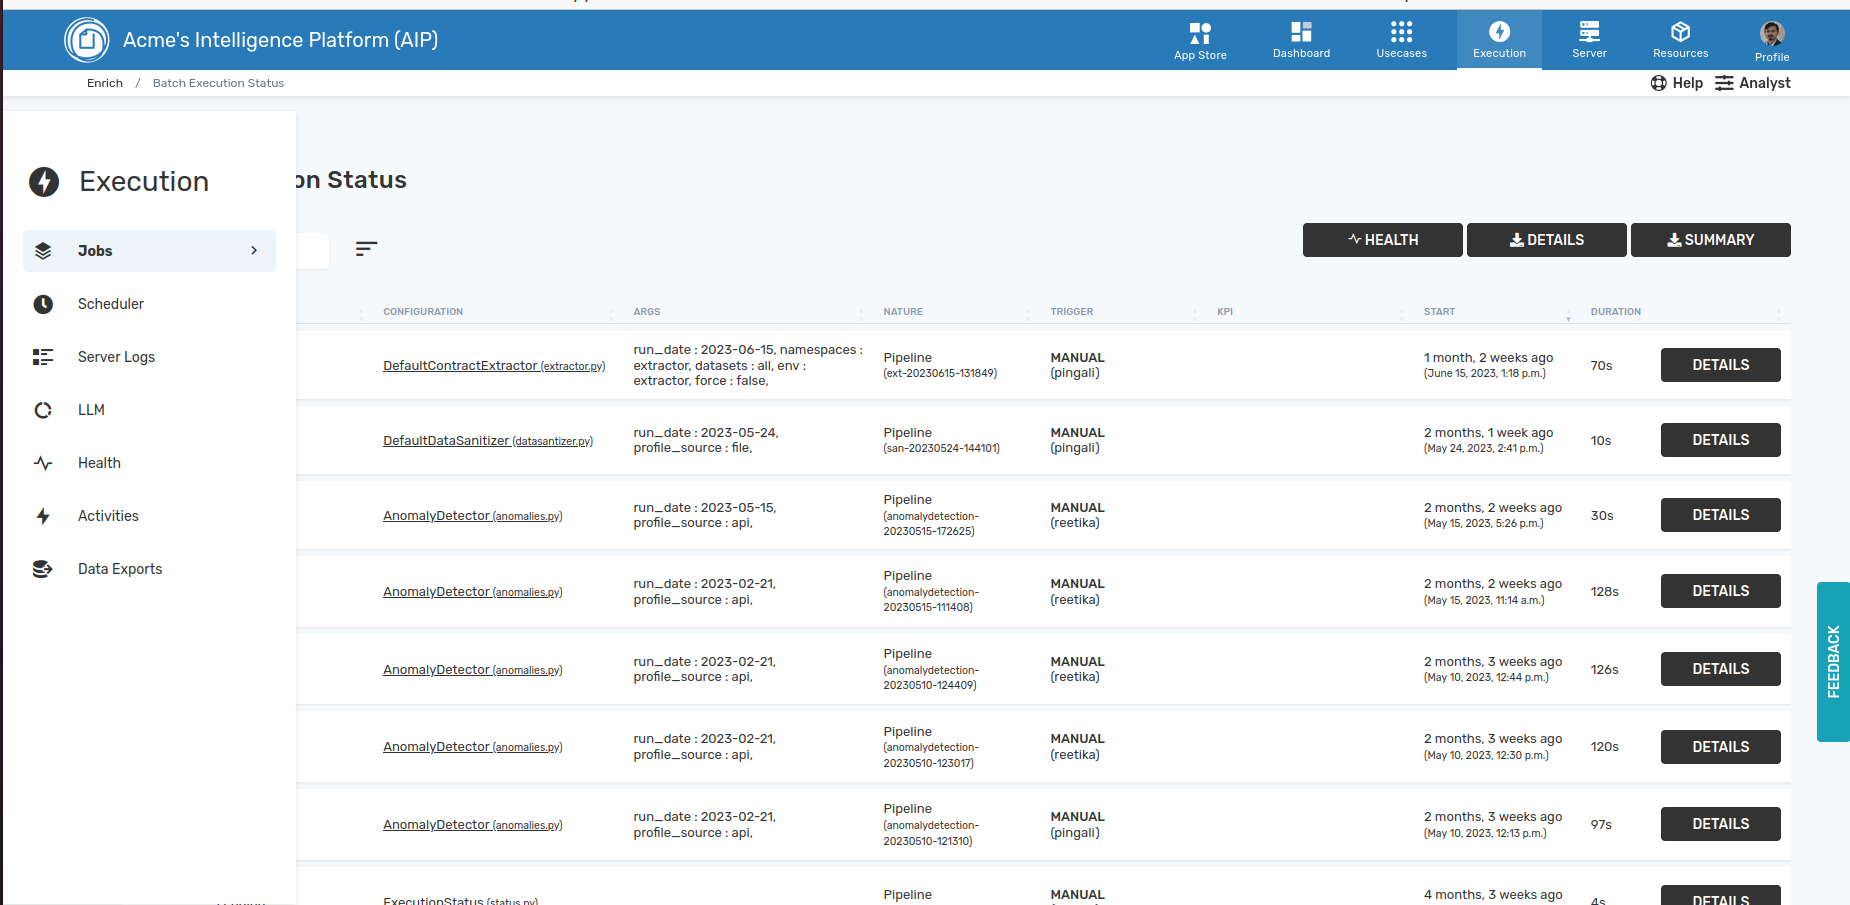
The execution status page shows all the pipelines that are running on the machine along with their latest status. Clicking on the details will take you to the run detail page.
The server logs gives information any issues with the dashboard operation such as errors found in any app or pipeline. This is usually the first place to chek in case of any issues.
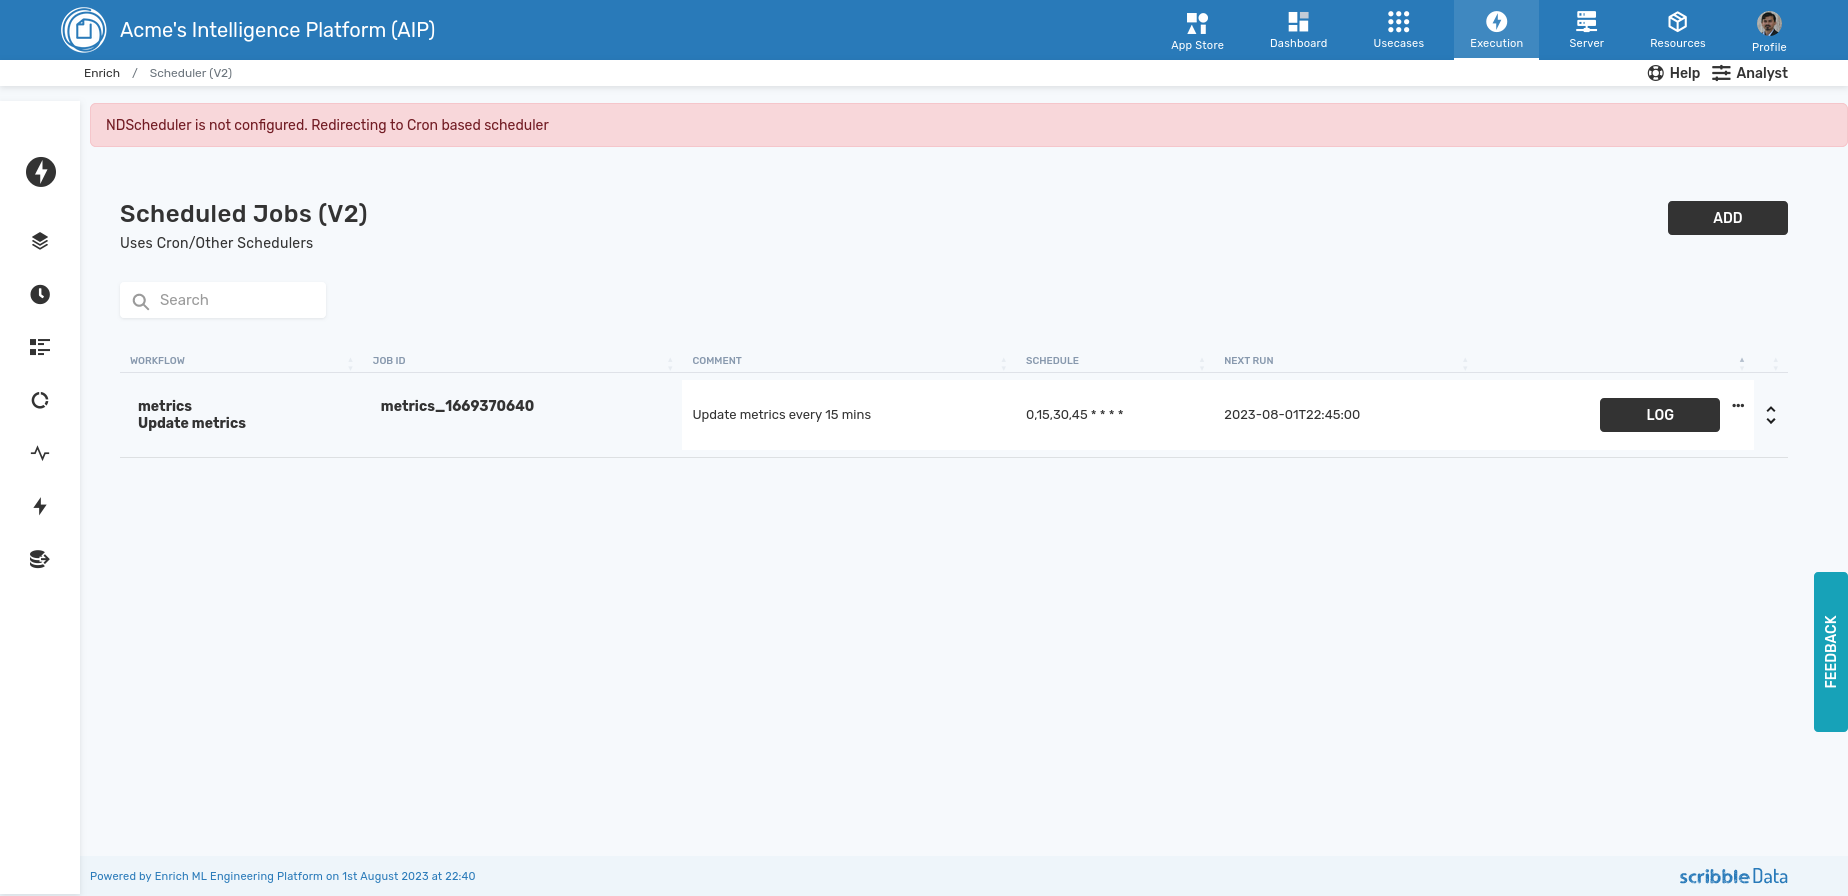
The scheduler will take you to the cron interface or any custom scheduler that has been deployed on the server. This interface allows the user to schedule workflows, see the log, and run the workflows if necessary.
The activity interface allows us to log and understand the activity of the users in a single place. The utilization of the product by user and application can be downloaded from this interface
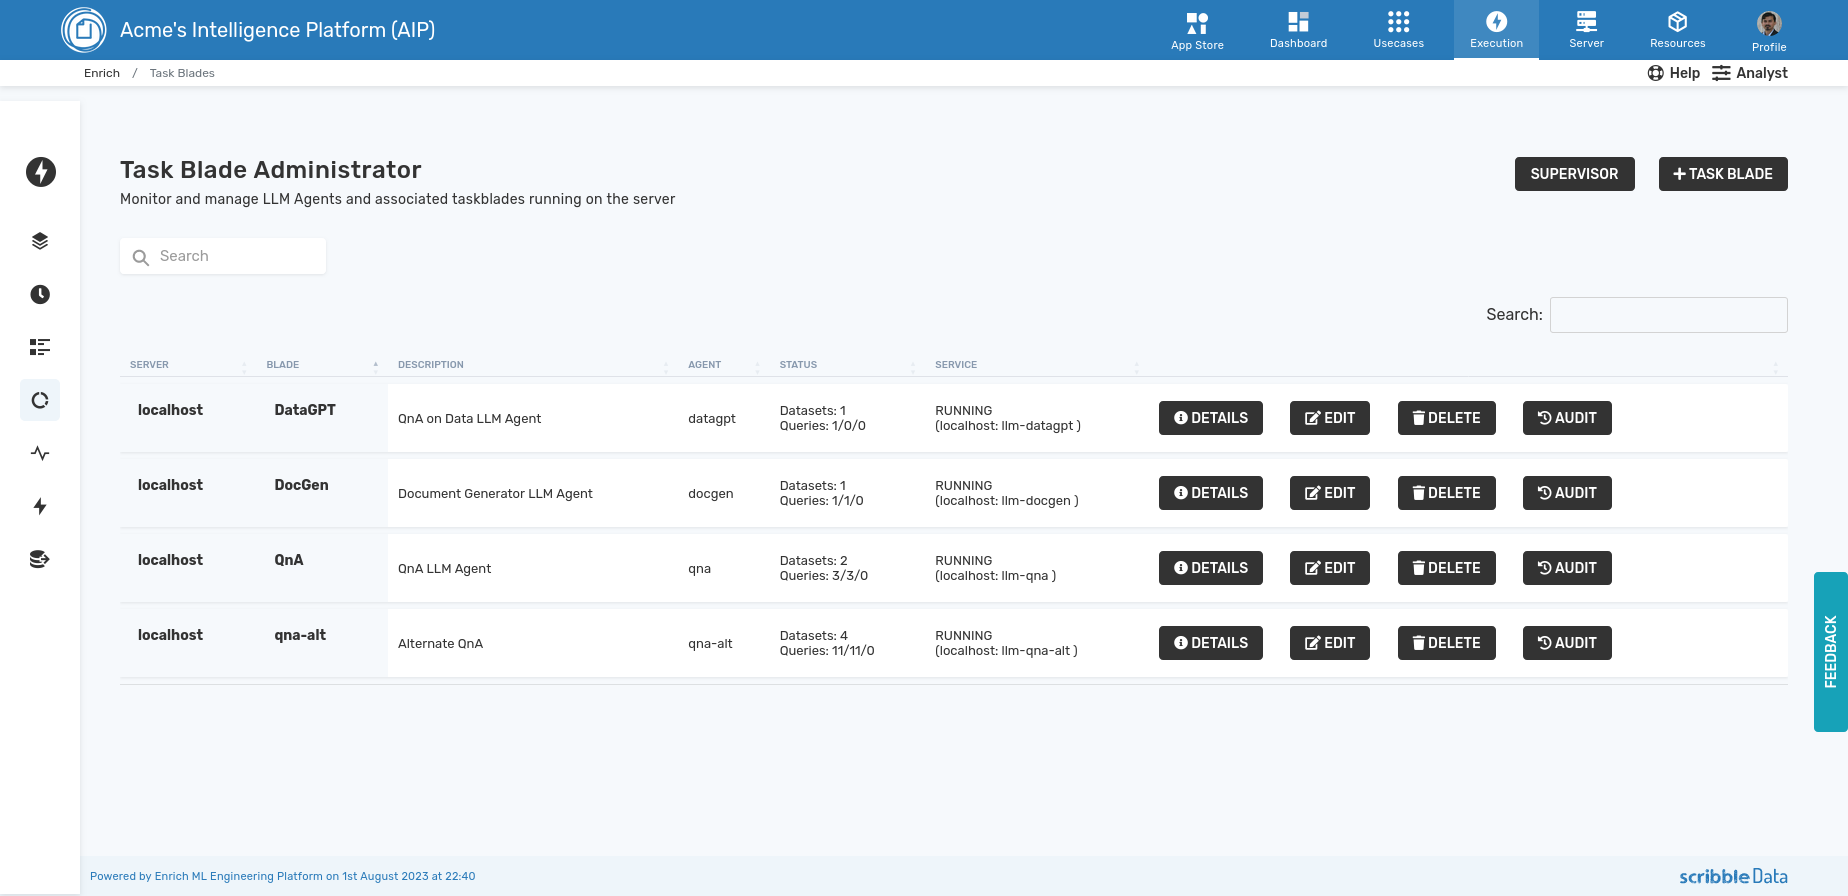
LLM→
The dashboard provides an interface to manage the GenAI deployment as part of the execution management.
The overview page shows all the taskblades (task-specific GenAI backend services) that have been configured, whether they are hosted on the local machine or a remote server, and ability to start/stop these (locally hosted ones).
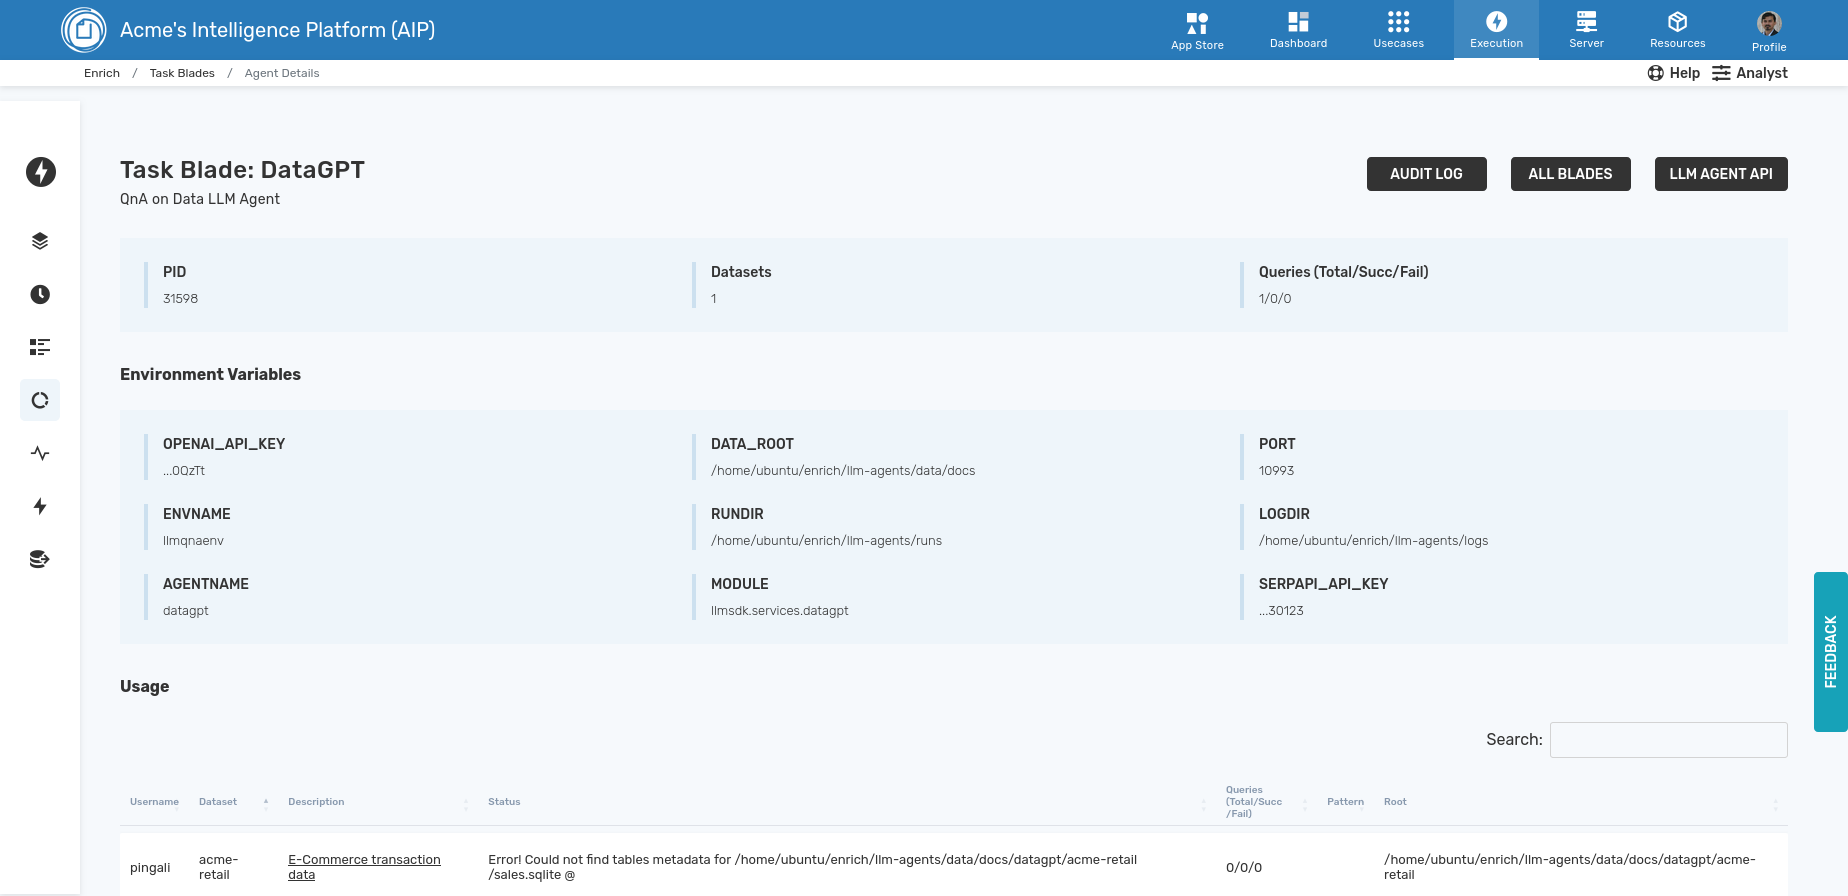
When we click on the details page, we can see the configuration variables, log, users who are accessing the blade, and associated audit log.
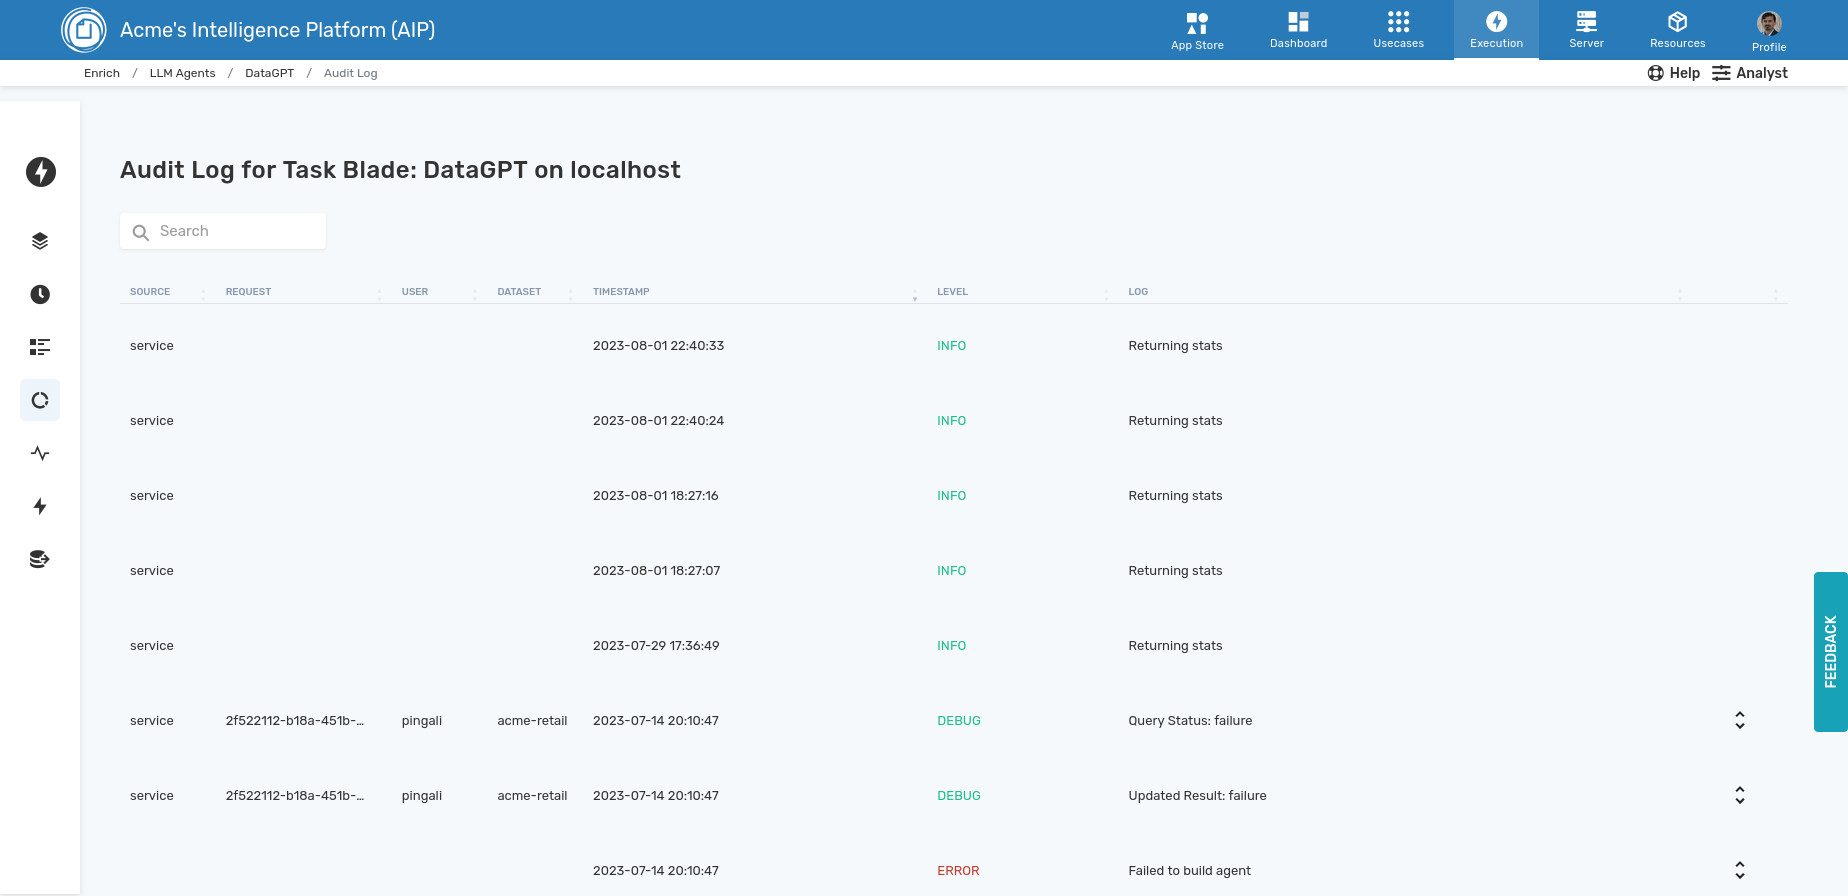
The audit shows a trace at an individual request level, and details of request and response.
Server Status→
The server status menu is meant to capture the health of the server along various dimensions including:
- Engine - status and details of all components deployed, processes and server.
- Upgrade - online upgrade server with the pipeline modules
- Configuration - See the various parameters associated with the server and update them if necessary
- Resource Monitor - Status of cpu, memory and other resources, if configured
- Authorize - RBAC management interface
- License - Check the validity of the server license
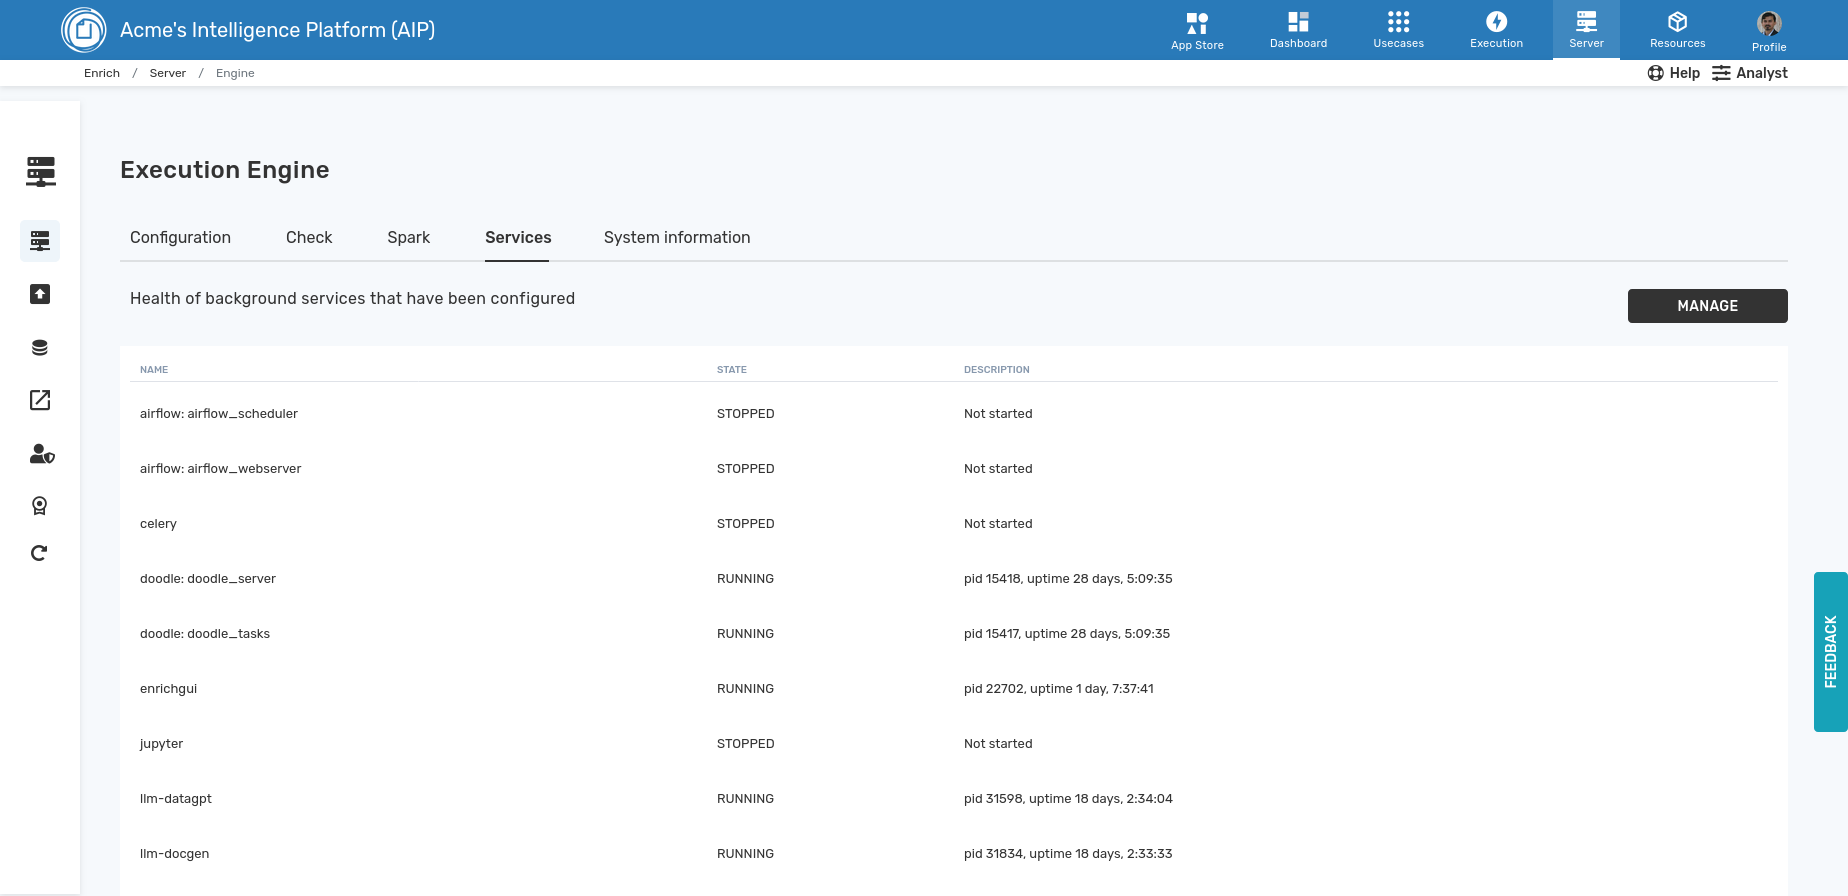
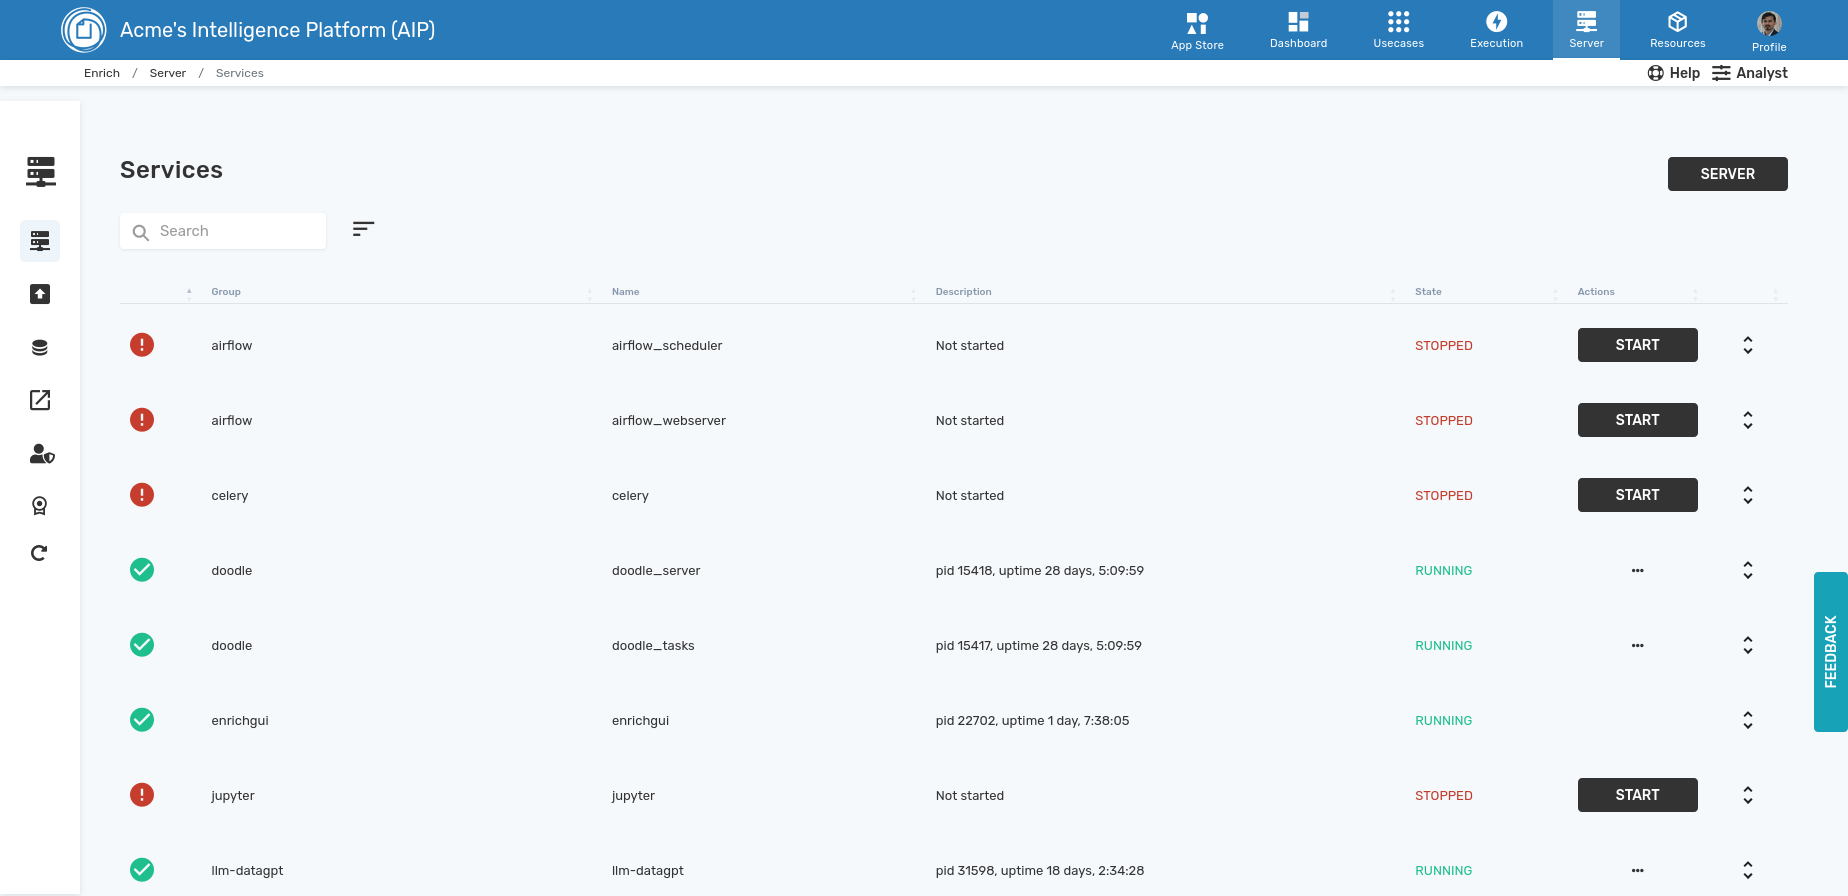
The sidebar shows the various options
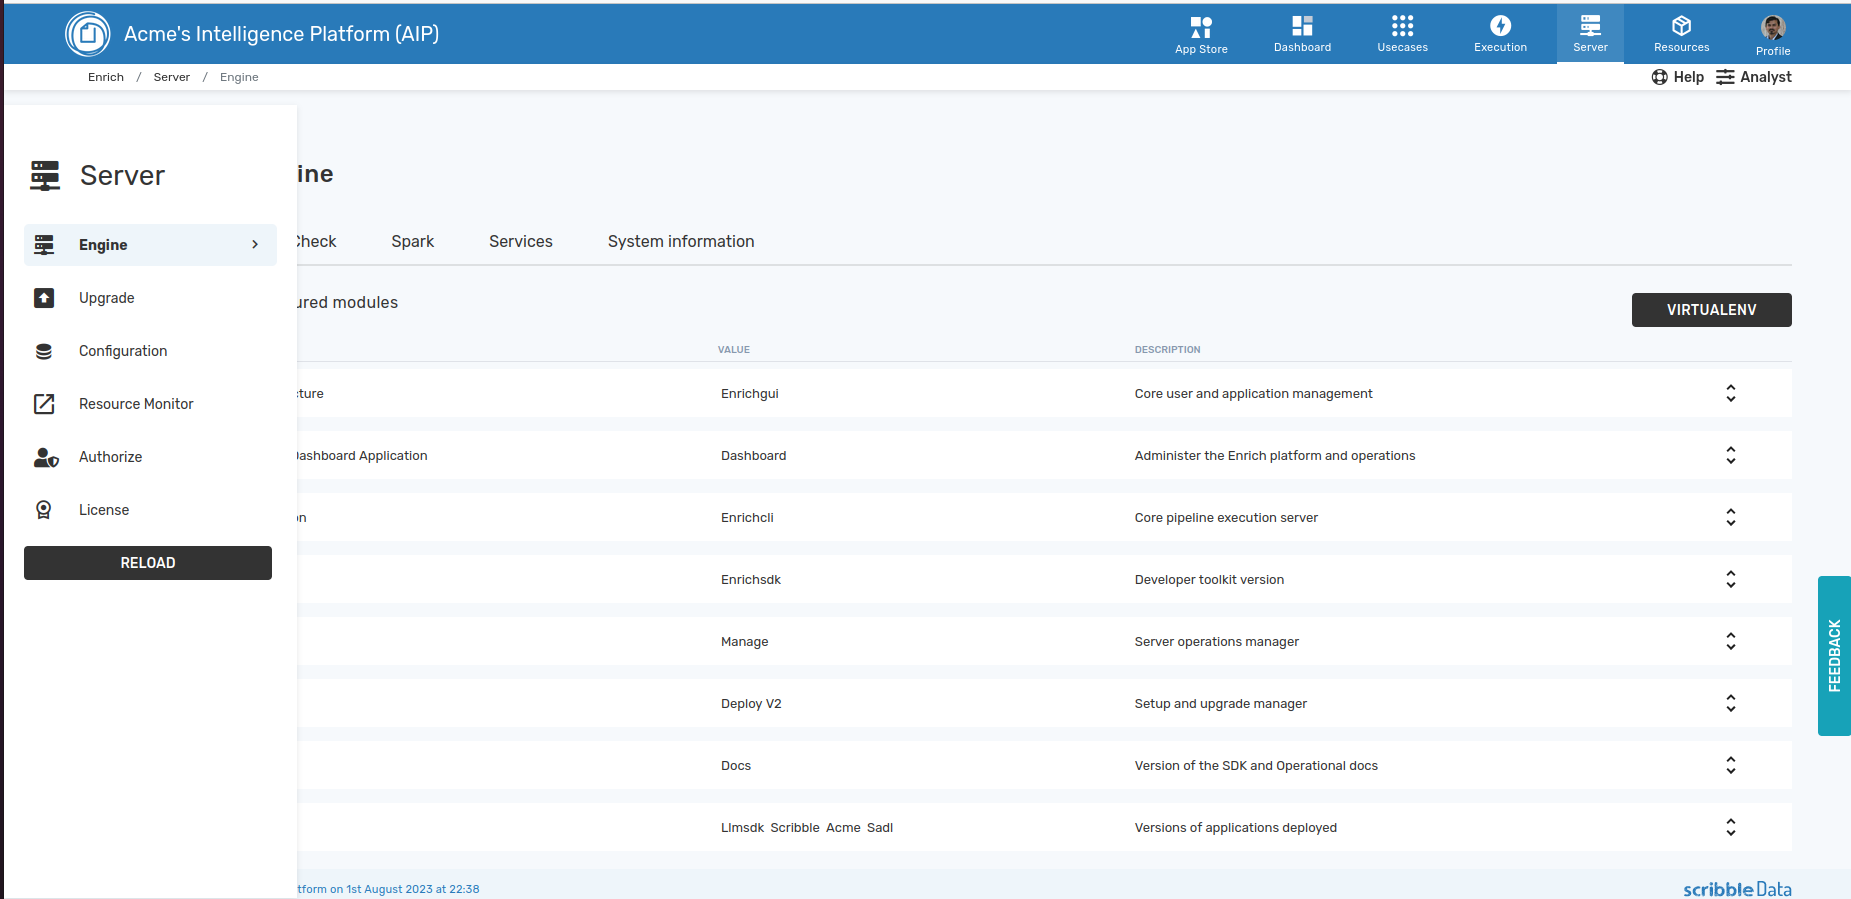
The configuration page shows 1. Versions of the modules deployed 2. Result of a health check of the system 3. Status of on-server spark deployment, if any 4. Status of various services deployed. We use supervisord to manage them. 5. System resource information
Resources→
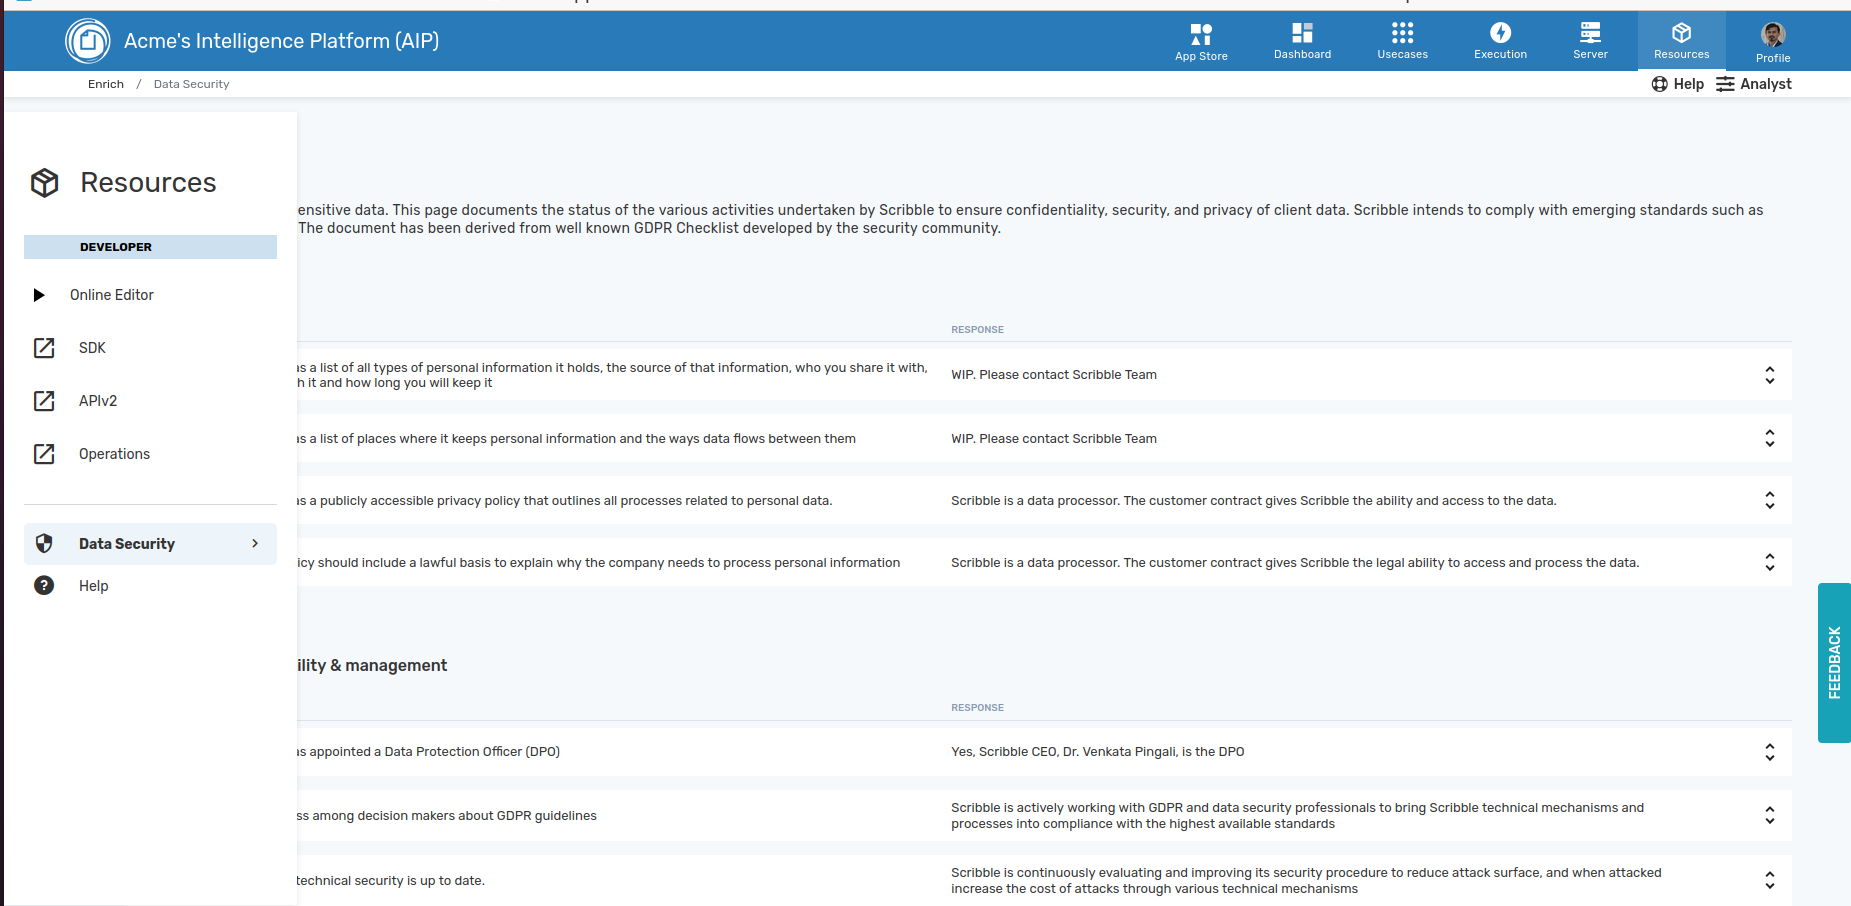
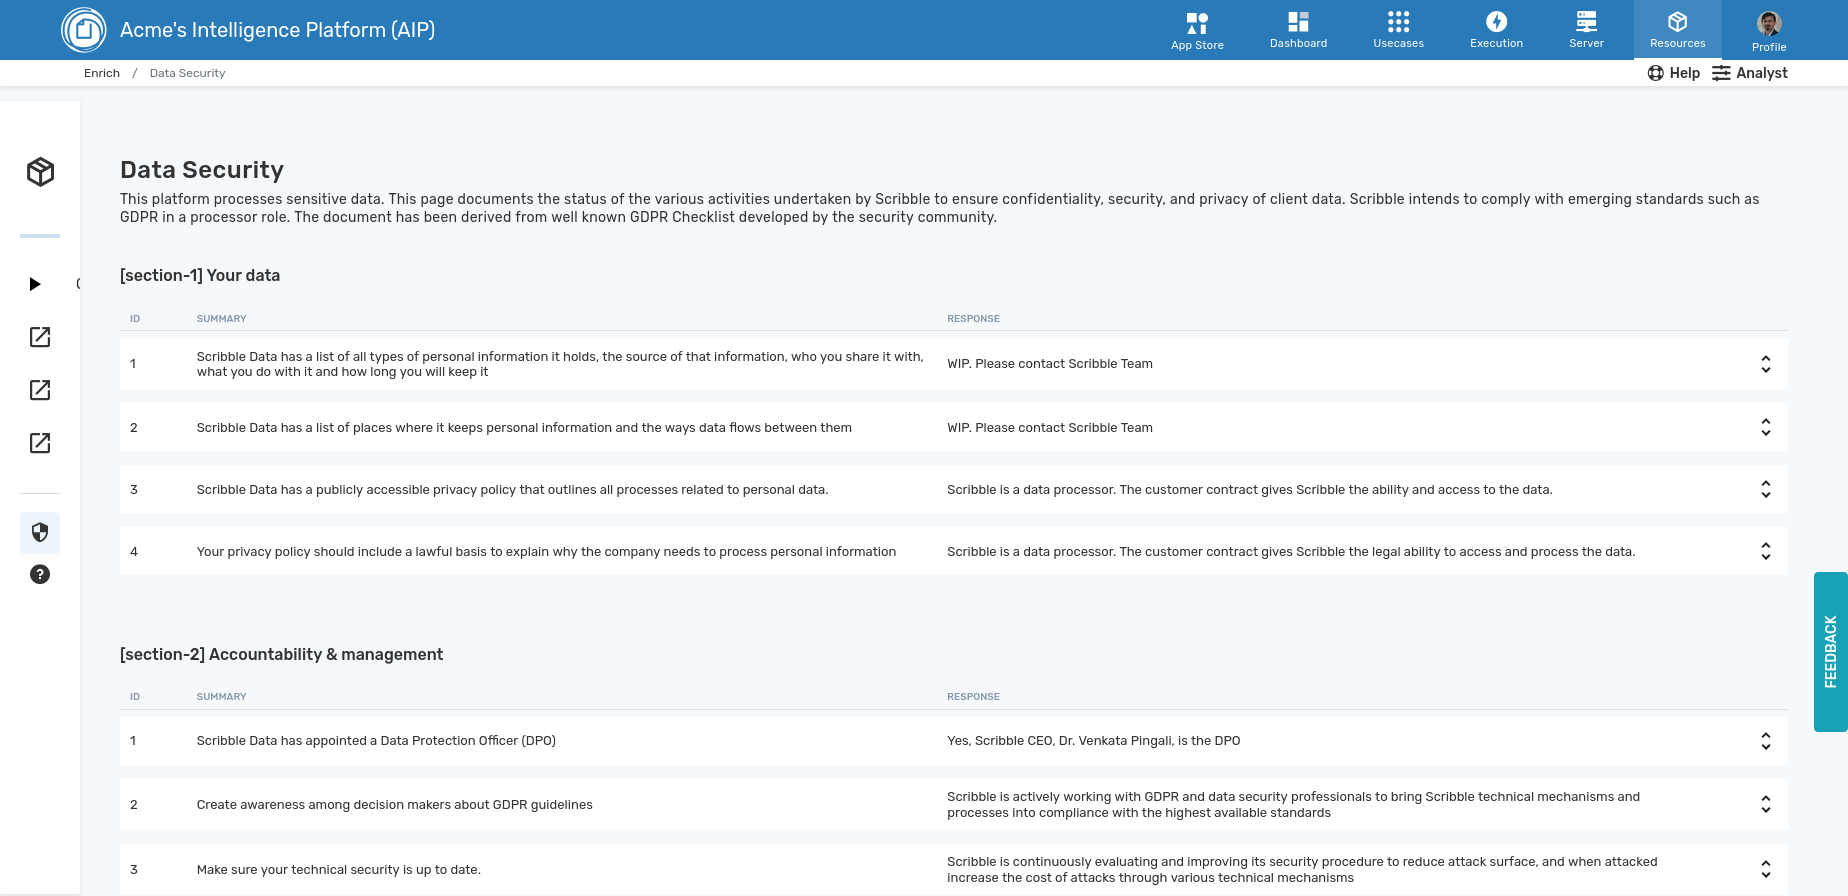
This menu provides additional information required for operations such:
- Security - disclosure on the security posture and practices
- FAQ - background on the server
- About - details on the platform provider - Scribble Data
- Help - helpdesk contact for support requests